Yesterday my patch adding import/export of connection settings to geodatabases and WMS servers was accepted.
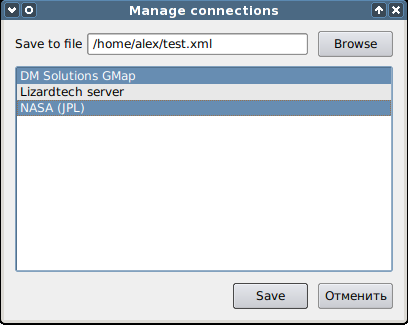
When the user clicks on the import/export button, the following simple window appears
Manage connections dialog
The file to which the data will be written (or from which it will be imported) is selected at the top, and the connections from that file are displayed below. Multiple selection can be made using the Ctrl and Shift keys, also list items can be selected by dragging the mouse.
Once you have saved the file, you can transfer it to another machine and add the necessary connections in a few clicks.
I also forked Tim’s ImagesToShape plugin, rewrote it to use the EXIF.py module and added some improvements. This is how Photo2Shape was born. It is already released, but there is not much feedback yet, or rather none at all :-).
Recently Tim Sutton published a blog post about geotagging with free software and released his QGIS plugin for it. The plugin uses the exiv2 library and requires the python-exiv2 package, which is not available on Windows/OSGeo4W. Therefore ImagesToShape is not available from the plugins repository.
As I’m interested in geotagging myself, I contacted Tim and offered to rewrite the plugin, abandoning exiv2 in favour of a pure Python module.
QGIS 1.4 “Enceladus” has been released, the announcement can be found on the official blog. This release contains over 200 bug fixes and about 30 new features. It is notable for a new symbology system, a more advanced PAL-based feature labelling engine and other improvements.
Meanwhile, the developers are working on the trunk: it is already possible to reload Python plugins without restarting QGIS, the Python console has been practically rewritten, support for GPS devices has been added, diagrams and plots now use Qwt…
And there is another hackfest planned for the end of March in Italy, details here. I’d love to go, but I don’t know if I’ll be able to.
I’ve already submitted some patches for fTools, now it’s time to look at GdalTools. I have already added an “Info” tool to display information about the raster, implemented internationalisation support, added several new options to the “Merge” and “Warp” tools, and now I am working on a batch mode. There are also plans to add more tools.
Hopefully I will be able to get most of the work done before the New Year, and then I will start improving Statist and developing another plugin.
Less than a month has passed since the release of QGIS 1.2.0 and now… 1.3.0 is available. Pretty fast, huh?
There are not that many changes, mostly bug fixes and minor improvements. There is a tendency to switch to native analysis tools (i.e. not related to GRASS), for example this version includes the “Raster terrain analysis” plugin for terrain analysis.
The announcement, as usual, is available on the official blog.
Release. There are a lot of changes, especially in the digitising tools: undo/redo support, history of edits, feature simplification and merging, ability to remove holes in polygons, and many other useful features. And also added support for attribute table field aliases, support for keyboard shortcut customisation, plugin and provider for working with OpenStreetMap… going through all the new features will take a long time.
The so-called visual changelog can be found on the developers’ blog. I haven’t translated the announcements in the wiki into Ukrainian and Russian yet because the official version isn’t ready yet. I think it will be cleaned up by tonight, and then I can start translating.
I wanted to build QGIS on Windows using MSYS + MinGW. So, I gathered all the necessary programs and libs, updated the QGIS code from SVN and, armed with the “Coding and compilation guide”, set to work. It took my Sempron almost two evenings to compile the dependencies and QGIS itself. It went well at first, but when I got to avce00, I stuck. That thing would not compile at all, throwing warnings and errors at almost every line. I gave up and grabbed the binaries from OSGeo4W. That did the trick.
And this is the moment. It’s compiled. I run it and… and nothing. QGIS crashes at the beginning of loading. I run it from the console — it crashes again, leaving an “Access violation” message in the terminal. So here I am scratching my head and trying to figure out who to blame: avce00, my two left hands or spots on the sun. There are many reasons for this behaviour. Even developers say that building with MSYS and MinGW is quite a complex process.
I decided to postpone it for now, and in the meantime, I will try to build QGIS with VisualStudio Express. I need it for work.
I continue to work on the Statist plugin. It’s been a while since I updated the public repository — I’ve been working with my local copy. But today I uploaded a pretty big update.
Among the most notable changes:
ability to export frequency distribution histogram in PNG, PS, EPS, SVG and PDF formats
added toolbar with interactive plot navigation tools such as zoom and pan
the frequency distribution can be displayed as a histogram or a line graph.
ability to manually set range for both axes
improved and more polished UI
extended number of statistical values calculated by the plugin
fixed the issue with the broken plot resizing when changing the plugin window size.
There is only one major bug left (there are probably others, but they have not shown up yet) — in some cases, the histogram is displayed in a rather strange, I would say suboptimal, way. I have some ideas about how to fix this and will have to test them.
Enjoy the plugin. If you have any problems and/or feature requests, do not hesitate to email the author :-).
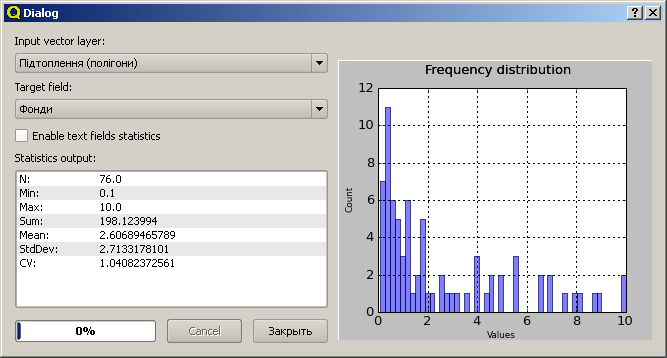
It is used to obtain statistical information on the specified field of the vector layer attribute table. Both numeric (integer, real, and date) and text (string) fields are supported. The plugin can work on the whole attribute table as well as on selected features. In addition to displaying basic statistical values, Statist also displays a frequency distribution histogram of the field values.
Statist plugin dialog
To use Statist, it is necessary to have matplotlib installed (it can be installed via OSGeo4W or downloaded from the project page, as it is used to display the frequency distribution histogram.
The plugin is available from my QGIS plugins repository. Comments, feature requests, and bug reports are welcome. It is best to post them in the bugtracker, but email is fine too.
If someone does not need a frequency distribution histogram and unnecessary dependencies, they can use the “Basic Statistics” tool from fTools (now included in core). After my patch, it has the same functionality as Statist except for the frequency distribution histogram.