Despite the fact that QGIS now has a built-in raster calculator, the RasterCalc plugin I developed is still quite popular. I don’t know how to explain it: either it’s a matter of habit, or my calculator is more convenient… I’d like to know what the reason is, maybe I should make a poll.
Why this preface? For a long time, I’ve been “terrorised” by requests to add support for conditional operators to my plugin. The one guy from Spain was particularly active. And no matter how often I pointed out that I was busy with other projects, no matter how hard I tried to avoid it, nothing helped. After a short break, the “attacks” were repeated. Apparently, they had decided to wear me down.
The inclusion of a patch that added comparison operators (submitted by Ghislain Picard) didn’t help either. It was not enough, and it was not what they were looking for. People wanted more, something similar to r.mapcalc from GRASS and preferably with the same syntax.
Well… I have to admit, they got it. Today this most wanted feature is implemented. However, the syntax is different from r.mapcalc’s, because I didn’t want to make the already complex parsing code even more complicated. Now you can do things like:
compare pixel values with a constant and replace pixel values that meet the condition with another value
compare pixel values with corresponding pixels of another raster/band, and replace pixel values that match the condition with corresponding values from the third raster/band
other similar things
This nice feature is still in my local repository. I will not commit it to the public repository until the documentation has been updated. And I really don’t have the mood or energy to do that. I don’t like writing, whether it’s an essay, an article, or anything else. There are times when it is easy to write, but those are rare.
There is another reason or two, to be precise and honest. Firstly, I’m thinking about optimising the plugin a bit: operations on large rasters use a lot of CPU and memory. And secondly, that very active Spaniard made another feature request the other day, and I have a feeling that he will be as persistent in his efforts to get me to implement it as he was before.
But I haven’t made a final decision yet. Maybe the conditional operator should be enough for a new version and I should not bother with refactoring and optimisation? Or should I wait a bit, but release an even more powerful calculator and consolidate the success of the first versions?
I decided to improve my MergeShapes plugin a bit. I added encoding selection when opening files, shapefile geometry type selection and reworked the merge algorithm. Now, the final attribute table contains all unique fields from all input files, which means you can merge files with different attribute tables. The only missing bit is a setting for the default encoding of input data.
There are plans to improve DPSimplify, Statist and RasterCalc, but I don’t know how it will go yet.
I’ve also started to slowly learn Git, or rather to organise and deepen my fragmentary knowledge. I want to try out this VCS in real tasks, as there is already a Git mirror of the main QGIS SVN repository.
Yesterday I found out that my plugin — RasterCalc — was only announced on the QGIS mailing lists. I didn’t post anything on the forum or here. I don’t know how I could have forgotten. Although I have to admit that there was a lot of work going on at the time: RasterCalc itself, an experimental branch of GDAL Tools, Photo2Shape and many other things. QGIS 1.4 was released in January… I know it’s a weak excuse, especially considering that other plugins were announced all over the place, but I don’t have any others.
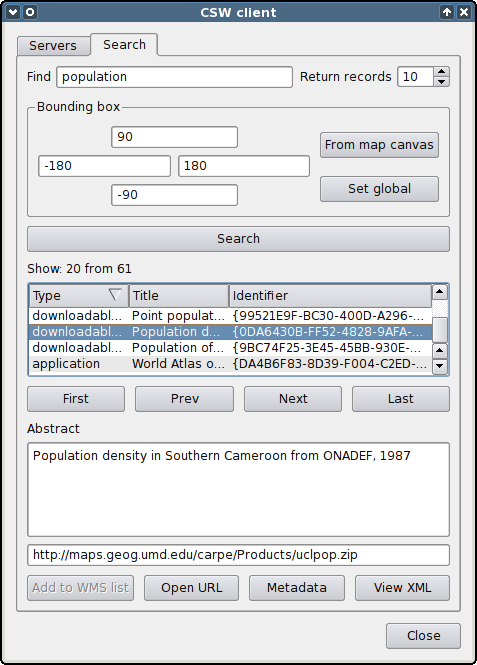
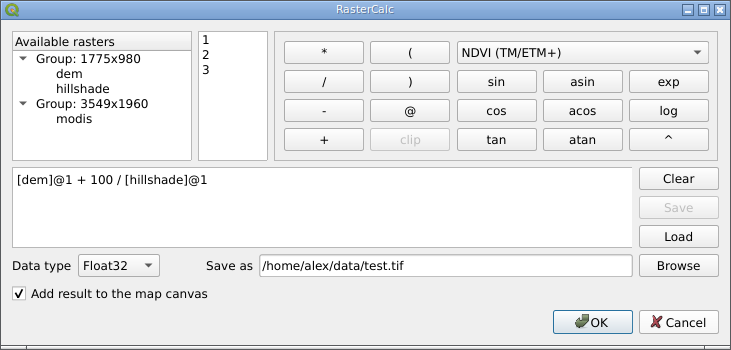
So… RasterCalc is a user-friendly and functional raster calculator written in Python. It was announced on the mailing lists on 16 January 2010.
RasterCalc window
RasterCalc was inspired by Barry Rowlingson’s RasterLang plugin. The main difference is the user-friendly interface and the familiar expression syntax (do you like LISP as much as Barry?). I have also added some additional features like saving and loading expressions, “templates” of formulas and extended the set of available functions and operators.
Weeks and months went by (I almost wrote “years”), nothing seemed to indicate any changes… And then, out of the blue, Marco Hugentobler and Tim Sutton decided to make RasterCalc part of the QGIS analysis library. This will allow its features to be used by other plugins, and remove the dependency on NumPy, pyparsing and other Python modules.
Marco has already published a first version of the patch. Some features are missing compared to the original plugin:
there is no support for “templates” of formulas (in RasterCalc there are two: “Difference” and “NDVI”)
the result can only be saved with Float32 data type
saving and loading of expressions is not supported
At the same time, new features have been added:
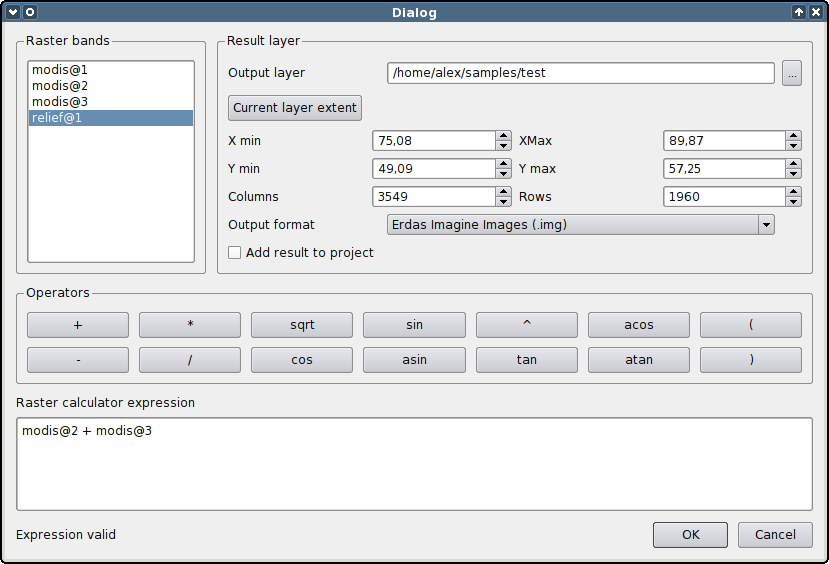
it is possible to specify the desired resolution and extent of the result. This allows rasters with different resolutions to be used in one expression. If necessary, the rasters are automatically resampled to the output resolution
result can be saved in various formats, not only GeoTiff
QGIS Raster Calculator
You can try out the new functionality by applying the patch and building QGIS from source. The calculator will appear in the “Layer → Raster calculator” menu.
The patch is still under development and some things may not work. The authors invite everyone to try it and report any bugs (if possible, attach a test dataset and steps to reproduce the issue).
GdalTools (or Raster Tools) is a plugin for the open source GIS QGIS. The main purpose of the plugin is to simplify the use of the GDAL command line utilities by providing the user with a graphical interface for the most common operations.
Initially, the plugin was developed by Faunalia, later other developers, including myself, joined them. Robert Szczepanek created nice icons for most of the tools, and the development of some features was sponsored by Silvio Grosso.
At the time of the first announcement (September 2009), the plugin provided only two tools: gdalbuildvrt and gdal_contour. Now the number of integrated tools is approaching 20.
Today we merged the experimental branch of the GdalTools plugin into the main development branch.
GdalTools (aka Raster Tools) provides users with a simple graphical interface to perform the most common raster processing tasks. Originally the plugin was created by Faunalia (Paolo Cavallini, Giuseppe Sucameli and Lorenzo Masini), the icons for the extension were created by Robert Szczepanek. About a month ago I also joined the work (and this experimental branch is my work).
This is what we ended up with:
the plugin is localised. In addition to the default English interface, there are Ukrainian and Russian translations (though not yet complete).
new tools: “Information”, “Build Overviews”, “Assign Projection”, “Clipper”
batch mode for tools “Build Overviews”, “Translate” and “Reproject”
new parameters “Use intersected extent” and “Layer stack” have been added to the “Merge” tool
it is now possible to change the output image size when reprojecting raster
almost all tools now have “smart” selectors - combined fields that can be used to select either the map layer or the file(s) on the disc.
results can be saved not only in GeoTiff, but also in any other format supported by the corresponding tool.
Yesterday my patch adding import/export of connection settings to geodatabases and WMS servers was accepted.
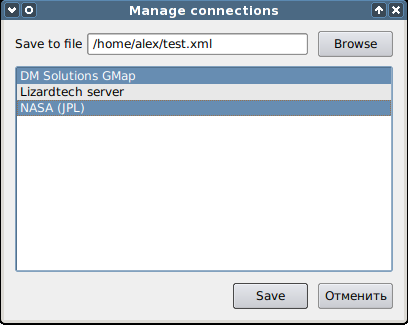
When the user clicks on the import/export button, the following simple window appears
Manage connections dialog
The file to which the data will be written (or from which it will be imported) is selected at the top, and the connections from that file are displayed below. Multiple selection can be made using the Ctrl and Shift keys, also list items can be selected by dragging the mouse.
Once you have saved the file, you can transfer it to another machine and add the necessary connections in a few clicks.
I also forked Tim’s ImagesToShape plugin, rewrote it to use the EXIF.py module and added some improvements. This is how Photo2Shape was born. It is already released, but there is not much feedback yet, or rather none at all :-).
Recently Tim Sutton published a blog post about geotagging with free software and released his QGIS plugin for it. The plugin uses the exiv2 library and requires the python-exiv2 package, which is not available on Windows/OSGeo4W. Therefore ImagesToShape is not available from the plugins repository.
As I’m interested in geotagging myself, I contacted Tim and offered to rewrite the plugin, abandoning exiv2 in favour of a pure Python module.
I’ve already submitted some patches for fTools, now it’s time to look at GdalTools. I have already added an “Info” tool to display information about the raster, implemented internationalisation support, added several new options to the “Merge” and “Warp” tools, and now I am working on a batch mode. There are also plans to add more tools.
Hopefully I will be able to get most of the work done before the New Year, and then I will start improving Statist and developing another plugin.
I continue to work on the Statist plugin. It’s been a while since I updated the public repository — I’ve been working with my local copy. But today I uploaded a pretty big update.
Among the most notable changes:
ability to export frequency distribution histogram in PNG, PS, EPS, SVG and PDF formats
added toolbar with interactive plot navigation tools such as zoom and pan
the frequency distribution can be displayed as a histogram or a line graph.
ability to manually set range for both axes
improved and more polished UI
extended number of statistical values calculated by the plugin
fixed the issue with the broken plot resizing when changing the plugin window size.
There is only one major bug left (there are probably others, but they have not shown up yet) — in some cases, the histogram is displayed in a rather strange, I would say suboptimal, way. I have some ideas about how to fix this and will have to test them.
Enjoy the plugin. If you have any problems and/or feature requests, do not hesitate to email the author :-).