In the early morning of February 24, 2022, russia launched a treacherous, full-scale invasion of Ukraine, mirroring the atrocities of Nazi Germany during the Second World War. And we fight back. We fight for our lives, our families, our land, and our right to exist against one of the largest armies in the world.
I have decided to shut down my QGIS plugin repository. I will not allow my professional contributions and expertise to benefit an aggressor state or its people: those who remain silent, do nothing, openly endorse this war, or refuse to accept their responsibility, while our women and children are murdered and our cities are destroyed.
To those who have remained silent while witnessing these crimes and chose to maintain “business as usual”: your silence is a position. My repository will remain offline until the war ends, our lands are liberated, and those responsible for these war crimes are held accountable.
As QGIS 3.0 has entered the “hard freeze” phase, it is time to update the plugins. I decided to start with Processing providers, as they are the most relevant. As of today, all of them are updated and available for installation from my plugin repository:
Circuitscape for Processing — analysis of heterogeneous landscapes (for example, to model movement, gene flow of plants and animals, or to identify areas important for connectivity conservation)
WhiteboxTools provides a set of spatial analysis tools, primarily for raster data. It was developed as a response to numerous requests coming from users of the specialized GIS called Whitebox GAT. People wanted to use Whitebox GAT functionality in automated data processing workflows. At the time of this post, WhiteboxTools already contains more than 250 tools from Whitebox GAT and about the same number will be added in the near future. The WhiteboxTools for Processing plugin I have developed integrates these tools into QGIS.
The plugin is already available from my plugin repository. Only QGIS 3.0 (or newer) is supported. Currently, the plugin has an experimental status, so do not forget to enable experimental plugins in the QGIS Plugin Manager settings. In addition to the plugin, you should also download and install WhiteboxTools and specify their location in the Processing settings.
Have you ever tried to pass the coordinates of any location by phone or explain to someone where to find a specific place on a map in the absence of a map? This is not an easy task: not everyone can easily memorize long coordinates, and it is difficult to recognize them, especially when spelling over the phone. Of course, there are different techniques designed to simplify this. For example, one can say coordinate in full, spell it by individual numbers, or even use the International Phonetic Alphabet (of course, if interlocutors are familiar with it). But anyway, it is slow, inconvenient, and error-prone.
In such cases, the what3words service comes to the rescue. With its help, one can pass the coordinates of any location with 3 meters of accuracy in just three words. All you need to do is install the Android/iOS application or open the website, find the desired point on a map, and copy three words that encode the point’s coordinates. For instance, V. N. Karazin Kharkiv National University (Svobody square, 4), where the GIS-Forum 2016 is currently taking place, is at robes.mimics.array.
The service is free and already supports 8 languages. The number of supported languages grows every month.
QGIS users can install the plugin of the same name developed by BoundlessGeo. The plugin allows you to get the coordinates of any point in what3words notation and quickly navigate to a location defined by what3words coordinates.
I have released a new version of the Photo2Shape plugin. This is a QGIS plugin that allows you to create a point vector layer from a set of geotagged photos.
Users now have the ability to recursively process directories and the option to append data to an existing file. The code has also been refactored, and instead of EXIF.py the more convenient and reliable exifread is now used.
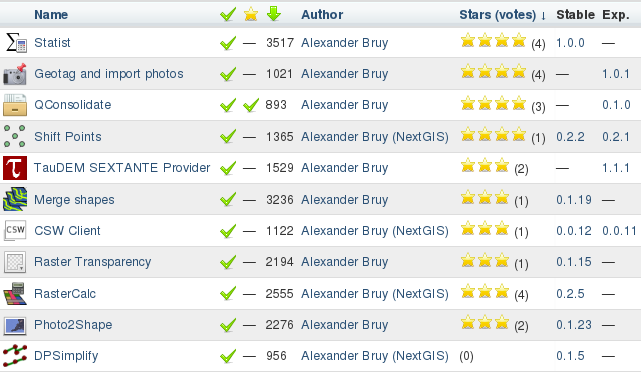
Two of my plugins are in the TOP-20 by downloads, 4 by ratings and 5 by votes. It’s a small thing, but it’s nice.
My plugins
Actually, the list is not complete, as there are still C++ plugins that are distributed as source code and plugins that are not published in the official repository. And some plugins, although they have been significantly reworked by me and are now maintained by me, were originally created by others.
QGIS plugin developers should note that it was decided at the hackfest to make changes to the plugin metadata. Namely:
added mandatory author field
added mandatory email field
the authorName field is declared deprecated and is ignored when parsing metadata
The new fields must be present in both the __init__.py file and the metadata.txt file. The purpose of this change is to separate the actual author of the plugin from the plugin maintainer. For plugins already uploaded to the repository, these metadata fields will be filled in automatically using information from LDAP, but for all new plugins, these fields should be set by the developer.
One type of data used in GIS is geotagged photos, i.e., photos whose metadata includes the coordinates of the location where the photo was taken. But there are not many tools for working with such photos in QGIS: all that comes to mind are eVis, photo2shape and its little-known ideological parent, ImagesToShape. In principle, these two modules are sufficient for many tasks. You can use photo2shape to map the locations of photos and use eVis to view geotagged photos and link them or other documents to features of a vector layer. Sooner or later, however, a task will arise for which the capabilities of the existing tools are not sufficient.
Geotag and Import Photos is a new QGIS plugin developed for NaturalGIS. It allows you to process geotagged photos, geotag them and create a point shapefile from them.
Key features:
batch geotagging photos using a point shapefile or manually defined coordinates
add custom tags and/or modify existing tags in batch mode
create a point shapefile with a fully customisable list of attributes from a set of geotagged photos
There is a software called TauDEM (Terrain Analysis Using Digital Elevation Models). It provides a free (GNU GPL v2) set of tools for extracting and analysing hydrological information from digital elevation models. TauDEM is developed by David Tarboton of the Water Research Laboratory at Utah State University.
The tools are written in C++, are cross-platform, and have a console interface. Users of ArcGIS 9.3.1 and 10.0 can install an add-on that allows them to run the tools from ArcToolbox using simple dialogs. For others, the only way to use TauDEM is the “scary” command line.
Recently, QGIS also got a powerful and convenient framework that allows easy integration of various tools and libraries (yes, I’m talking about SEXTANTE). Thanks to this framework, QGIS users who need hydrology tools now have a way to use TauDEM directly from QGIS.
Of course, you need to have TauDEM installed in order to use the plugin. While the installation on Windows is quite simple (there are compiled files and detailed installation instructions on the site), Linux users will have to build TauDEM themselves.
Statist. My first plugin for QGIS. That was a long time ago: 2009, QGIS 1.0.0, start of discussions about including fTools in the core (yes, fTools was a regular plugin that had to be installed manually), only a few third-party plugins, and almost no instructions on how to write Python plugins… And I was younger and didn’t know much (to be fair, I still have a lot to learn).
The last major update of the plugin was also in 2009: I was happy with the functionality, and there were no critical bugs. Later, as I gained knowledge and experience, I thought about refactoring several times, but it didn’t work out. And recently, something came over me, so I sat down and did it.
Users will probably not notice any difference, as there are not that many changes visible to them: only support for getting statistics on joined fields has been added. But there are many more changes under the hood:
the code to check for the presence of matplotlib has been rewritten
new signal-slot connection syntax is used
completely rewritten code for calculating statistics
unused and duplicate code was removed and classes were moved into separate files
system font is used for histogram labels
The plugin now lives in my repository, please report bugs and feature requests by mail or in the bugtracker (preferred).