Statist
Statist calculates a statistical summary for a given field of a vector layer. The calculated statistical summary includes minimum, maximum, mean, standard deviation, and other key statistical values. The plugin also displays and allows to explore a frequency distribution histogram of values from the selected field.
Installation
The plugin is available via my repository.
Prerequisites
Statist requires matplotlib — a Python plotting library. Please install matplotlib >=1.5 in your Python environment before using the plugin:
- Windows: run the OSGeo4W Setup and install the
python3-matplotlibpackage. - Linux: install the corresponding package via your distribution’s package manager.
- macOS: install the
matplotlibpackage into the QGIS Python environment usingpip.
To install it, please follow these steps (for more details, see the QGIS User Guide):
- Start QGIS.
- Go to Plugins → Manage and Install Plugins….
- Go to the Settings tab and click Add… to add a new repository.
- Enter repository name, e.g. “Alex Bruy’s plugins”.
- Enter the repository URL https://plugins.bruy.me/plugins.xml.
- Click OK to close the Repository details dialog.
- Go to the All tab.
- Search for Statist, select the plugin in the list and click Install Plugin.
Usage
Once installed and enabled, Statist creates a submenu in the QGIS “Vector” menu and also adds its button to the “Vector” toolbar. If you don’t see the toolbar button, please make sure that the “Vector” toolbar is enabled.
Clicking on the plugin’s button or menu item will open the Statist dialog. You can also use Shift + S shortcut to open it.

Select the layer to compute statistics on from the “Layer” combobox. If you only interested in statistics for the selected features in the layer, activate “Selected features only” checkbox; by default it is unchecked and analysis will be run against all features.
Select the field you are interested in from the “Field” combobox. Once field is selected, the plugin will begin calculation of the statistics. Please note, that the time needed to calculate the statistical summary depends on the number of features to process and the speed of your computer. During calculation process the plugin will show a progress bar and a button allowing to terminate statistics calculation.
On successful calculation, the results will be shown in a table. The statistical summary can be copied to the clipboard by pressing Ctrl + C in the plugin dialog or by clicking on the “Copy Statistics to Clipboard” button above the table.
To recalculate statis summary when the underlying layer changes (for example, features added/removed or attribute values modified) use “Recalculate Statistics” button above the table.
In addition to the statistical summary, a frequency distribution histogram will be created. The number of histogram bins is determined automatically using Sturges and Freedman-Diaconis estimators.
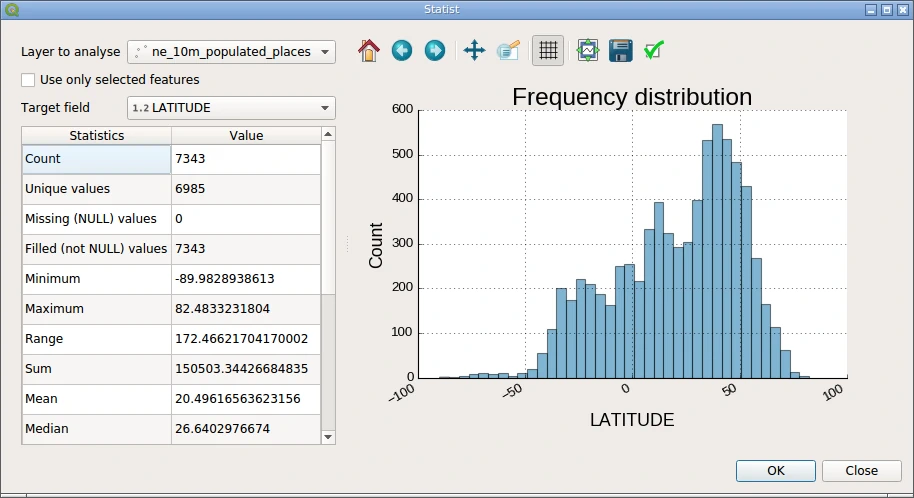
Use the toolbar above the frequency distribution histogram to explore it. You can pan, zoom in/out, toggle grid, etc… Also, the histogram can be exported into one of the following formats: PNG, PS, EPS, SVG, and PDF.
Please refer to the matplotlib documentation for more details about using the toolbar.
Reporting bugs
Please report bugs and submit feature requests via bugtracker.