QGIS vs. MapInfo
A small but interesting comparison of QGIS and MapInfo https://woostuff.wordpress.com/2010/12/06/mapinfo-and-qgis-an-overview/.
A small but interesting comparison of QGIS and MapInfo https://woostuff.wordpress.com/2010/12/06/mapinfo-and-qgis-an-overview/.
29.11.2010 14:56 · GIS · qgis, release
QGIS 1.6 “Copiapó” has been released. This version contains over 177 bugfixes and many improvements. Among the most interesting changes are:
An updated User Guide is also available (English only for now).
22.11.2010 17:27 · GIS · qgis, plugins
I decided to improve my MergeShapes plugin a bit. I added encoding selection when opening files, shapefile geometry type selection and reworked the merge algorithm. Now, the final attribute table contains all unique fields from all input files, which means you can merge files with different attribute tables. The only missing bit is a setting for the default encoding of input data.
There are plans to improve DPSimplify, Statist and RasterCalc, but I don’t know how it will go yet.
I’ve also started to slowly learn Git, or rather to organise and deepen my fragmentary knowledge. I want to try out this VCS in real tasks, as there is already a Git mirror of the main QGIS SVN repository.
Follow up to the GDAL RFC 29 post.
Last night, I submitted a patch to add SetIgnored support to the SQLite driver. Literally an hour later, it was applied. This means that the two most important drivers have already been made to work faster.
Frank Warmerdam today applied changes proposed by Martin Dobias in RFC 29: OGR Set Ignored Fields. Martin’s patch was developed as part of the GSoC project and aims to improve the speed of reading data from OGR datasources. The new functionality is currently only available in the shapefile driver. I think we should expect this functionality to appear in other drivers soon.
For QGIS, this news marks the beginning of a new stage in its development, as the inclusion of the patch in the GDAL code, along with other improvements made as part of the QGIS on Steroids GSoC project, will significantly increase performance when rendering vector layers.
15.10.2010 17:41 · GIS · qgis, plugins, rastercalc
Yesterday I found out that my plugin — RasterCalc — was only announced on the QGIS mailing lists. I didn’t post anything on the forum or here. I don’t know how I could have forgotten. Although I have to admit that there was a lot of work going on at the time: RasterCalc itself, an experimental branch of GDAL Tools, Photo2Shape and many other things. QGIS 1.4 was released in January… I know it’s a weak excuse, especially considering that other plugins were announced all over the place, but I don’t have any others.
So… RasterCalc is a user-friendly and functional raster calculator written in Python. It was announced on the mailing lists on 16 January 2010.
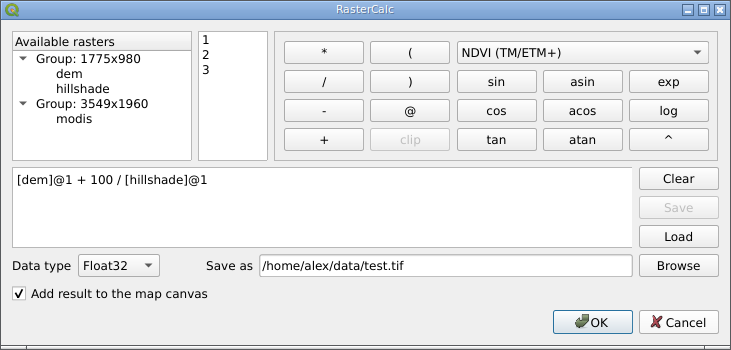
RasterCalc was inspired by Barry Rowlingson’s RasterLang plugin. The main difference is the user-friendly interface and the familiar expression syntax (do you like LISP as much as Barry?). I have also added some additional features like saving and loading expressions, “templates” of formulas and extended the set of available functions and operators.
Weeks and months went by (I almost wrote “years”), nothing seemed to indicate any changes… And then, out of the blue, Marco Hugentobler and Tim Sutton decided to make RasterCalc part of the QGIS analysis library. This will allow its features to be used by other plugins, and remove the dependency on NumPy, pyparsing and other Python modules.
Marco has already published a first version of the patch. Some features are missing compared to the original plugin:
Float32 data typeAt the same time, new features have been added:
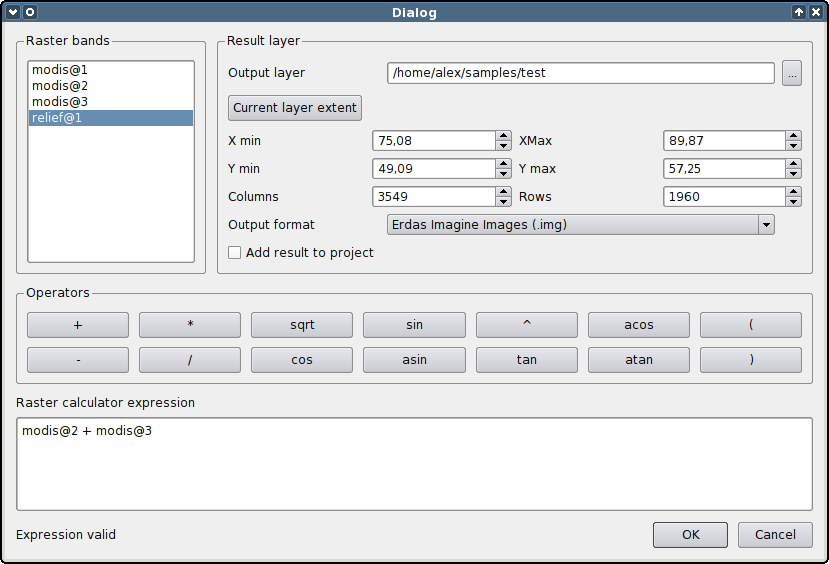
You can try out the new functionality by applying the patch and building QGIS from source. The calculator will appear in the “Layer → Raster calculator” menu.
The patch is still under development and some things may not work. The authors invite everyone to try it and report any bugs (if possible, attach a test dataset and steps to reproduce the issue).
Yay! The collaborative project to translate the QGIS 1.5 User Guide into Russian is finished. It took 1 month and 18 days, and 15 people participated.
During the translation process, many typos and inaccuracies were found, which, in the best tradition of open source, were corrected not only in the translated version but also in the original manual. Thanks to the perseverance of the project members, several major problems in the English version, such as the lack of a subject index and bibliography, have been fixed.
The translated user manual (PDF format, ~10 Mb) is now available on the QGIS website.
12.10.2010 18:01 · GIS · gdal, python, tips
Imagine you have a vector layer containing polygons, both single- and multipart. Your task is to get vertices of each geometry, including all rings and parts. Here is how it can be done using GDAL and Python.
Let’s start with simplest case — singlepart polygons. In that case everything is straightforward — we need to find out the number of vertices, iterate over them and get their coordinates. The code will look like this:
def dump_geometry(geom):
    print "Exterior ring"
    ring = geom.GetGeometryRef(0)
    for i in range(ring.GetPointCount()):
        print i, ring.GetX(i), ring.GetY(i)
A polygon with “holes” is considered as a set of “rings”: one outer ring defining the polygon boundary and several inner rings describing the “holes”. The outer ring always comes first. Thus, the algorithm will transform as follows: loop over all rings; if it is the first iteration — this is an outer ring, otherwise — inner ring; extract vertices from the ring and output their coordinates.
def dump_geometry(geom):
    nRings = geom.GetGeometryCount()
    for i in range(nRings):
        ring = geom.GetGeometryRef(i)
        if i == 0:
            print "Exterior ring"
        else:
            print "Interior ring", i

        for j in range(ring.GetPointCount()):
            print j, ring.GetX(j), ring.GetY(j)
Handling multipart polygons is more complicated: they can be either singlepart polygons or contain “holes”, “islands”, or even “holes” and “islands” at the same time. Let’s try to figure out how to deal with them. A polygon consisting of several “islands” can be considered as a set of independent polygons. In turn, each of those polygons can have one or more rings. So what we have now:
So, this is a classical recursion and the final function will look like this:
def dump_geometry(geom, file):
    geomType = geom.GetGeometryType() # geometry type
    # singlepart polygon
    if geomType == ogr.wkbPolygon or geomType == ogr.wkbPolygon25D:
        nRings = geom.GetGeometryCount() # number of rings
        print "Rings", nRings
        if nRings == 1: # there are no "holes" in the polygons
            print "Exterior ring"
            ring = geom.GetGeometryRef(0)
            for i in range(ring.GetPointCount()):
                print i, ring.GetX(i), ring.GetY(i)
        else: # polygon with "holes"
            for i in range(nRings):
                ring = geom.GetGeometryRef(i)
                if i == 0:
                    print "Exterior ring"
                else:
                    print "Interior ring", i

                for j in range(ring.GetPointCount()):
                    print j, ring.GetX(j), ring.GetY(j)
    # multipart polygon
    elif geomType == ogr.wkbMultiPolygon or geomType == ogr.wkbMultiPolygon25D:
        for i in range(geom.GetGeometryCount()):
            subGeom = geom.GetGeometryRef(i) # for each polygon part
            dump_geometry(subGeom) # recursively call dump_geometry() function
The code is a bit bloated, but my aim was to demonstrate a possible way of approaching the task, not to come up with an ideal solution.
A collaborative project to translate the QGIS 1.5 User Guide into Russian is announced. I will lead and coordinate the project. Please share information and get involved, and don’t hesitate to contact me if you have any questions.
Marco Hugentobler wants to merge his project, QGIS mapserver, into the QGIS source code.
QGIS mapserver is an open source WMS server that runs on Linux, Windows and Mac OS X (other Unix-like systems should also be supported, but have not been tested). The server is a FastCGI application written in C++. It uses QGIS libraries for rendering and GIS operations.
Among the main features:
GetCapabilities, GetMap, GetStyle, GetFeatureInfo requests and customisable styles based on the Styled Layer Descriptor specification (supported standards include WMS 1.3.0, WMS 1.1.1 and SLD 1.0.0).