Tables in GIS Geoproject report generator
01.10.2008 18:10 · GIS · geoproject, howto
Probably everyone who has started to work with the Report Generator in GIS Geoproject has asked the question: “How can I insert a table in a template?” This question comes up again and again because tables are one of the main elements of various cadastral and geodetic documents (just think of coordinate lists, azimuth tables, and land explications).
At first glance, the lack of standard tools like in MS Word or OOo Writer makes this task impossible. But this is only at first sight. In reality, FastReport, and thus the Report Generator, are at least as good as text editors when it comes to creating tables.
What is a table? With a bit of imagination, any table can be thought of as a building made up of individual ‘bricks’ - cells. And what is a table cell? It is just text in a frame. The solution has been found!
Indeed, every table is a set of framed text blocks. We already have framed text blocks Memo (TfrxMemoView), those who need more fancy text can use RichText (TfrxRichView). All we need to do is place the required number of these “bricks” on the page, set their sizes, enable borders, fill them with text, and “build” the table. To make the result of our work look more like a real table, you can group all the elements into a single block.
Despite its fixed form, our table can do a lot: we can change values in cells right in the process of report generation. These values can be either the semantics of some object or the results of some calculations or manipulations with strings. Examples of the described approach are such standard templates as “Technical Documentation (State Act)” (see the last page), “Plan with Stamp 1” and “Plan with Stamp 2” (see the stamp itself and the table of land explication); in older versions of Geoproject, besides these templates, there were such templates as “Reg Card (Side 1)”, “Reg Card (Side 2)” and “Reg Card (Lease)”.
Fixed tables are fine, but what if the number of rows in the table is not known in advance? Is it a dead end, and you have to manually create a table with the required number of rows each time? Not at all. As Baron Munchausen said, “There are no hopeless situations”, and there are two ways out of this situation. First, we will consider a simple, I am not afraid to say primitive, variant, and finally — a more elegant and, at the same time, more complicated one.
Option 1. A “head-on” solution
It’s not suitable for all cases, but it’s simple. Among the disadvantages, I would like to mention:
- the large amount of code required for implementation
- the size of the template increases significantly
- inconvenience of use in the case of bulky tables (more than 5-10 rows and 3-4 columns)
Although this method has been used quite extensively in my own early templates and no problems have been observed, I recommend that you carefully consider whether it is appropriate to use this approach in your documents.
The easiest way to explain this method is to use an example. Suppose we have a certain number of plots and need to generate the following table
| N | Landowner | Intended use | Area, ha |
|---|---|---|---|
| 1 | Owner name | use definition | plot area |
Let’s assume that the maximum number of plots to be processed is 10 (or any other not-too-large number). This means that we know the maximum number of rows in the table. Let’s start with this number. First, we need to create a table with the required layout for the maximum number of records. The column “N” can be filled with data immediately, as these values will not change if we choose a different set of plots.
To store the data, let’s define three arrays (one for each column) and write code to collect the necessary information:
var
  //землепользователь и целевое
  OwnerName, Target: array [1..10] of string;
  //площадь участка
  LandArea: array [1..10] of double;
  //служебные переменные
  i: integer;

begin
  //перебираем выбранные участки и сохраняем семантику в массивы
  for i:=0 to SelectCount-1 do begin
    OwnerName[i+1]:=Semantic(FindCode(i+1), ’0061’, 0);
    Target[i+1]:=Semantic(FindCode(i+1), ’0014’, 1);
    LandArea[i+1]:=Area(FindCode(i+1), 1);
  end;
end.
Now fill the table by putting the appropriate variables into the cells. It should look something like this
| N | Landowner | Intended use | Area, ha |
|---|---|---|---|
| 1 | [OwnerName[1]] | [Target[1]] | [LandArea[1]] |
| 2 | [OwnerName[2]] | [Target[2]] | [LandArea[2]] |
| … | … | … | … |
| 10 | [OwnerName[10]] | [Target[10]] | [LandArea[10]] |
If we now test the template, we will see that regardless of the number of plots selected, the entire table is displayed, but the number of rows with data is equal to the number of selected sections. All that remains is to hide the empty rows. You can do this manually each time or leave it to the Report Generator.
To avoid confusion, I recommend giving the table cells meaningful names that indicate the column and row: for example, mNom1…mNom10 for the ordinal number; mOwner1…mOwner10 for the name of the plot owner, and so on.
To hide unnecessary rows use the following code (add it right after the loop we wrote before):
case SelectCount of
  1: begin
    // hide the second line and everything after it
    mNom2.Visible:=false;
    mOwner2.Visible:=false;
    mTarget2.Visible:=false;
    mArea2.Visible:=false;
    mNom3.Visible:=false;
    mOwner3.Visible:=false;
    mTarget3.Visible:=false;
    mArea3.Visible:=false;
    …
    mNom10.Visible:=false;
    mOwner10.Visible:=false;
    mTarget10.Visible:=false;
    mArea10.Visible:=false;
  end;
  2: begin
    // hide the third line and everything after it
    mNom3.Visible:=false;
    mOwner3.Visible:=false;
    mTarget3.Visible:=false;
    mArea3.Visible:=false;
    mNom4.Visible:=false;
    mOwner4.Visible:=false;
    mTarget4.Visible:=false;
    mArea4.Visible:=false;
    …
    mNom10.Visible:=false;
    mOwner10.Visible:=false;
    mTarget10.Visible:=false;
    mArea10.Visible:=false;
  end;
  …
  9: begin
    // hide the last line
    mNom10.Visible:=false;
    mOwner10.Visible:=false;
    mTarget10.Visible:=false;
    mArea10.Visible:=false;
  end;
end;
I hope this is enough to understand the principle and catch the pattern. Since the whole table is visible from the start, there is no point in processing the variant with the maximum number of rows — everything will be displayed as it is.
Yes, it’s cumbersome, it’s sub-optimal, it’s ugly… But it works.
Option 2. Feel like a pro
The more flexible and ideologically correct solution, without the disadvantages of the previous method.
It is based on band technology, and the author assumes that the reader is familiar with the band mechanism. If this is new to you, please refer to the FastReport documentation (“Building Reports → Using Bands” and beyond), where everything is described in great detail and in an accessible way.
We will consider the implementation using the same example as in the previous section.
As you know, data bands are “printed” for each record in a database (table). A table in this case is defined as “a previously unknown number of rows (records), each containing a certain number of columns (fields)” (© FastReport 4.0 User Manual). As you can see, this is exactly our case. All we need to do is find that database.
That’s how we came to one of the features of Geoproject that distinguishes it from other GIS. The name of this feature is Virtual Database (VBD). It is called “virtual” for a reason: in fact, it is only a record counter, and no data is stored in this database. Before you can use the virtual database, you need to initialise it — set the number of records it will “store”. This is done by calling the following procedure
VBDCount(n);
where n is an integer specifying the number of records.
All data processing and output operations are left to the user. This is how it works:
- the necessary data are collected in some way
- the number of “records” in the database is set
- a data-band is added to the report
- the Virtual DB is set as the data source for the band
- when the report is generated, the data band is printed the specified number of times. The user should implement the output of the required information
As you can see, the developers have made every effort to make our lives easier.
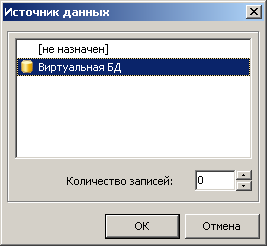
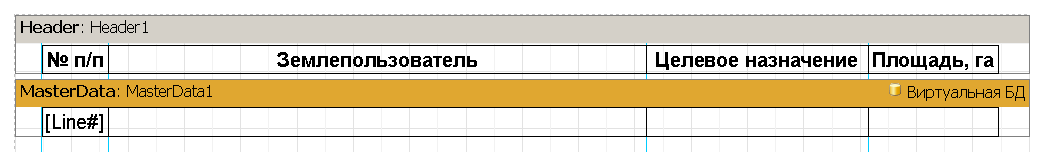
Let’s create the table: place the “Data Header” band on the page and place the table header in it. Under the header, place the “Level 1 Data” band; double-click on its header to open the “Data Source” window; select “Virtual Database” and click OK.
Create a table row from the text blocks. In the cell with the ordinal number add the following text:
[Line#]
This built-in variable returns the number of the current record in the database. All we need to do now is set the number of records in the virtual database by calling the VBDCount procedure:
begin
  VBDCount(SelectCount);
end.
That is, we set the number of records equal to the number of selected objects. If everything is done correctly, you should get something like this screenshot
Now you need to populate the table with the data. This, like many other things, can be done in a number of ways:
- define arrays of the required size in advance and output values from them
- generate the value right before populating the cell
- insert the call to the function that returns the semantic value directly into the cell
It is hard to say which method is better — this depends on your requirements and tasks. If you just need to generate a table and the cell contents are just the semantic values of the object, the last method is optimal. If you need to pre-process the values, the first and second methods are ideal. If the data is also needed for other purposes, I think it is unreasonable to ignore arrays (the first option). Of course, it is possible to combine these methods.
So you have decided to insert a Semantic function call with the necessary parameters into the cells. But first, we need to do a little customisation of the table cells: it is necessary to set different symbols to denote expressions. Select all the cells in the data band, and in the Object Inspector, change their ExpressionDelimiters property from [,] to something else, for example <,>. This is necessary so that the FastReport engine can process the expressions correctly. Now you can write a statement like this into the cells:
<Semantic(FindCode(<Line#>), '0014', 1)>
When the report is generated, the <Line#> variable is replaced with the ordinal number of the current object, and the table is populated with the appropriate semantic values.
Getting values from arrays is almost the same as using the Semantic function. Of course, arrays need to be pre-populated (you can use the code above to populate them). As in the previous case, the ExpressionDelimiters property of the cells must be changed, but the code inside them will be different:
<OwnerName[<Line>]>
here OwnerName is the name of the array containing the names of the plot’s owners. In the square brackets we specify the index of the element, which is the same as the ordinal number of the object.
And finally, the last way to fill cells: for each text block we create an OnBeforePrint handler where the required value is assigned to the Text property.
procedure MemoOwnerOnBeforePrint(Sender: TfrxComponent);
begin
  MemoOwner.Text:=Semantic(FindCode(<Line#>), '0014', 1)
end;
Not often, but there are situations where it is impossible to create a table using any of the methods described above. But what if your case is such a rare one? Then you have only one way out — to build the table programmatically during report generation. There is no specific recipe here, almost everything depends on the table itself and your requirements. An excellent example of this approach is the “Border Catalogue” template created by Sickle (the template can be downloaded from the support forum). Those who want to create tables “on the fly” will easily understand it.
Tips & tricks
Finally, I would like to give you a few tips:
- activate the grid alignment for objects (menu “View → Preferences”, tick the “Align to grid” checkbox)
- use guides, they make it much easier to create tables
- do not use the
RichTextcomponent for table cells, as the size of the template will increase significantly. Besides, this component has no advantages over a regular text component (Memo). - when the table is finished, it should be grouped. This simple action will save you a lot of time and hassle if you need to move the table to a different place on the page or to a different template.
- it is much easier to read a long table if the header is repeated on each page and the alternating row colour mode is enabled
That’s all I wanted to tell you about tables. Good luck in mastering GIS Geoproject!
A test project for the standard DZK-Script script and two templates implementing the described table creation methods can be downloaded here.