PlaneView object in GIS Geoproject report generator
03.09.2008 19:54 · GIS · geoproject, howto
One of the most commonly used primitives of the Geoproject 5.x GIS Report Generator is the Cadastral Plan component (PlaneView). Its short description can be found in the “Geoproject 5” GIS User Manual (chapter 11 Designer — Document Template Editor). Since this component is very powerful and most templates will need it, and since there is not much information in the manual, I think it is time to get to know it.
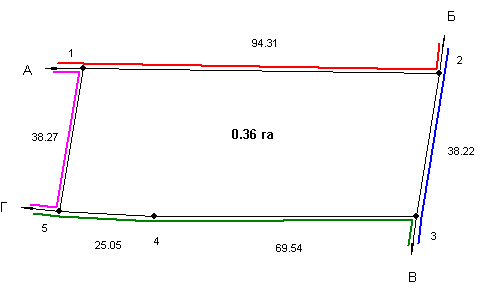
The component provides a rectangular area in which the objects selected for printing (quarters, plots, sites, etc.) are displayed.
Main properties
The full list of object properties can be found in the Object Inspector (accessible by pressing F11 or via the menu “View → Toolbars → Inspector”). In addition to the common properties such as size, description and alignment, there are also properties that are unique to this component. All the properties are described in the Geoproject manual, but it would be useful to go through them here:
Map_Grid— controls the display of coordinate grid intersections. Iftruethe intersections are displayed; otherwise, they are not. The default value isfalse.Map_LandBot— together with theMap_LandTopproperty, determines the number of objects to be displayed. It specifies the minimum index of the object to display. This property should only be used when multiple objects need to be displayed in thePlaneView. The default value is 1.Map_LandCode— contains the code of the displayed object. If the value is not 0, the object with the specified code will be displayed regardless of the user’s selection. The default value is 0.Map_LandTop— together with theMap_LandBotproperty, determines the number of objects to be displayed. It specifies the maximum index of object to display. This property should only be used when multiple objects need to be displayed in thePlaneView. The default value is 1.Map_Scale— controls the scale of the objects displayed in the component. The value should either be a scale denominator or be set to 0. In the latter case, the scale is automatically selected from the list of default scales, taking into account the component boundaries and the size of the objects selected for printing.Map_ScaleInfo— contains the current scale of objects in the component. It is usually used when theMap_Scaleproperty is set to 0. This is a read-only property.Map_View— defines the way objects are drawn:pmPrinter— printer view orpmDisplay— screen (aka display) view.
In my experience, people are most confused with the Map_LandBot and Map_LandTop properties, so let’s look at how they are used in a small example. Suppose we have two adjacent parcels of land, and we need to display them on a cadastral plan.
Option 1. Create two PlaneView objects in the template. Set the Map_LandTop and Map_LandBot properties of the first component to 1 (i.e., it will only show the first object selected for printing), and for the second component, set the same properties to 2 (it will only show the second selected object). With these settings, when we select two parcels, they will be displayed on our cadastral plan.
Option 2. There is only one PlaneView object in the template. Set Map_LandBot to 2 and Map_LandTop to 1 (I don’t know why it’s in reverse order, but it doesn’t work the other way around). Voilà! The same two pages, but a single component.
Graphical query settings
The properties described above are certainly useful, but the most interesting stuff can be found in the Graphical Query Parameters window. This window can be opened by double-clicking on the component or by selecting “Edit” from the component’s context menu. The “Graphical Query Parameters” window allows us to fine-tune the composition and appearance of the objects displayed by PlaneView. Almost all the useful features can be found here.
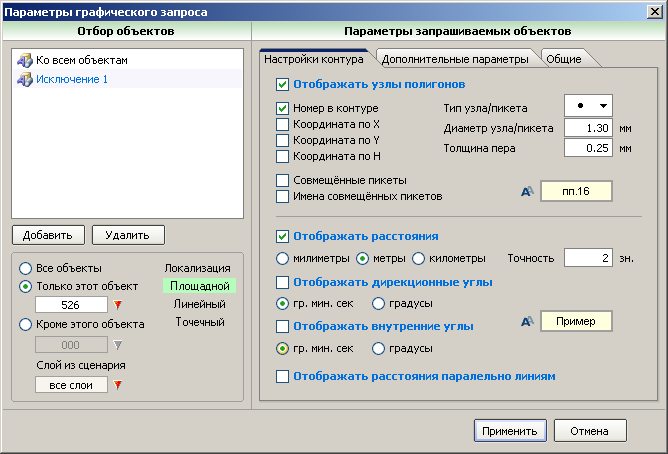
The window is divided into two parts: on the left is the “Object selection” panel, which allows you to select individual layers for customisation or to customise the display of all layers at once; on the right is the “Parameters of requested objects” panel, where the process of customising selected objects actually takes place. In turn, the “Object selection” panel is logically divided into two parts: the upper part contains the list of exceptions created, and the lower part displays the properties (parameters) of the selected exception.
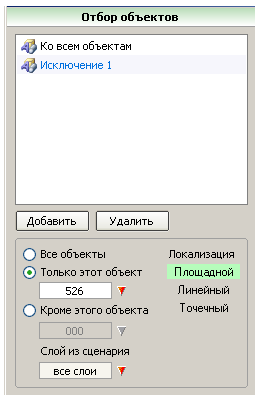
To create a new exception, use the “Add” button; to delete a selected exception, use the “Delete” button. In the list of exceptions, there is always a built-in item “To all objects”. As the name suggests, this exception allows you to customise the display of all objects at once. As this is a built-in exception, it cannot be deleted.
Activating the “All objects” option is essentially the same as using the default exception — the settings you make will affect all objects. By selecting the “This object only” option and picking a symbol from the list of available symbols in the script, you can define settings that only affect the appearance of the selected object. All other objects in the layer will be displayed either according to their own exception (if there is one, of course) or according to the settings specified by the “For all objects” exception. If you specify a layer in the “Layer from script” field, the settings will be applied to all objects in that layer, regardless of their number.
The “Parameters of requested objects” panel allows you to customise the appearance of the selected objects. It consists of three tabs. Let’s take a closer look at each of them.
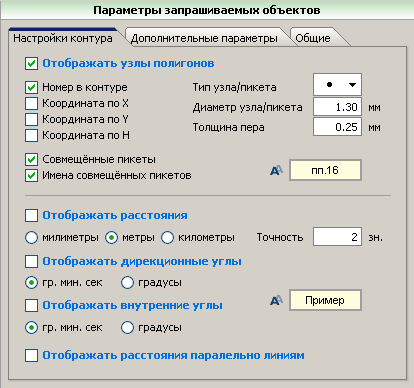
Contour Settings tab
Here we can set the thickness of the contour lines, enable/disable the display of vertices and select an icon for them, customise the labelling of vertices, distances and angles.
The name of the “Show polygon vertices” checkbox is self-explanatory — when it is checked, the vertices of objects are displayed.
Note
There is a rake here that is often stepped on! Checking the checkbox itself will do nothing because the vertex symbol is not set by default, and the “Node/Vertex type” field looks like this:
To see the vertices, you need to set a different symbol for them.
The “Node/Vertex diameter” field is used to set the size of the vertices, and the “Pen thickness” field is used to control the thickness of the contour line. You can also enable different types of vertex labels (“Number in Contour”, “X Coordinate”, “Y Coordinate”, “H Coordinate”) and display dimensions, directions and internal angles in different units. The “Display distances parallel to the lines” check box allows you to control how the measurements are displayed: perpendicular or parallel to the contour lines. To change the font of the labels, click on the button with the letter “A”, there is a small preview area next to the button.
Advanced Options tab
Here you can configure additional information to add to the plan (area, perimeter, or a semantic string) and to set the parameters for displaying the object itself (with or without fill, whether to show it or not).
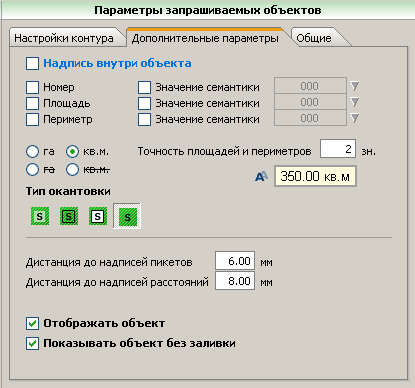
As you can see, we can control the visibility of selected objects (“Show object”) and enable or disable filling (“Show object without filling”). The latter is very useful for printing all sorts of “thematic” maps. Polygon labelling can also be enabled here, and if the default options of “Number”, “Area” (ha or sq. m.) and “Perimeter” are not enough, you can select up to three additional semantic values.
General tab
Actually, it should be called “Adjacencies”. This is where you customize the appearance of adjacencies and set the parameters of their labelling.
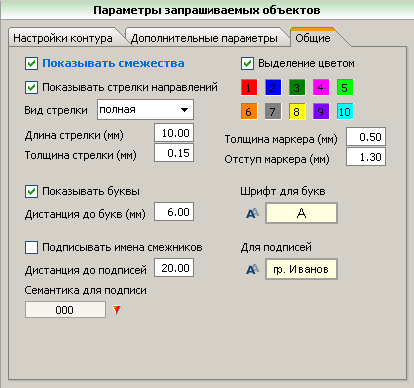
As mentioned above, the name of the tab does not quite reflect its contents. This tab is used to set up the adjacencies. You can show or hide adjacencies and highlight them with a colour (the colour can be changed by double-clicking on the box). It is also possible to customise the length, appearance and thickness of the arrows.
The “Marker thickness” field only makes sense when colour highlighting is active and is responsible for the thickness of this highlighting, and by changing the value in the “Marker indentation” field, you can control the position of the highlighting (to place it inside the outline or to display it outside). Here you can also enable the display of adjacent letters and show the value of some semantics.
This concludes our introduction to the PlaneView component. As you can see, there is nothing complicated or unusual here, practically everything is intuitive.