In the post about openModeller command-line tools, I have mentioned request files several times. When using openModeller from the command line, we have to deal with these files very often, as they allow us to perform almost all necessary actions and go from the input data to the results.
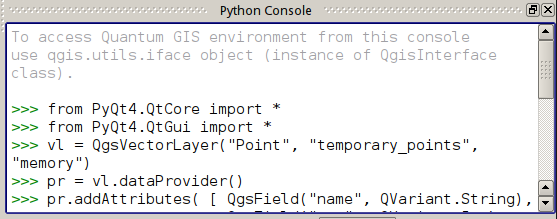
Most QGIS users are probably aware of the Python Console, even if they rarely use it. It is a window (accessible from the “Plugins → Python Console” menu) where you can interactively enter commands and access QGIS API functions.
QGIS Python Console
The Console is an extremely useful tool and comes to the rescue in many scenarios, from prototyping plugins to automating repetitive actions.
Obviously, typing commands every time you need to perform some task is inconvenient, so frequently executed code is transformed into scripts, and these scripts are then run from the Console. However, if the number of actively used scripts is large enough, using the console becomes a bit inconvenient. The Script Runner plugin by Gary Sherman was developed to solve this problem. The plugin is available from the official repository, has no dependencies, and can be found in the “Plugins” menu after installation.
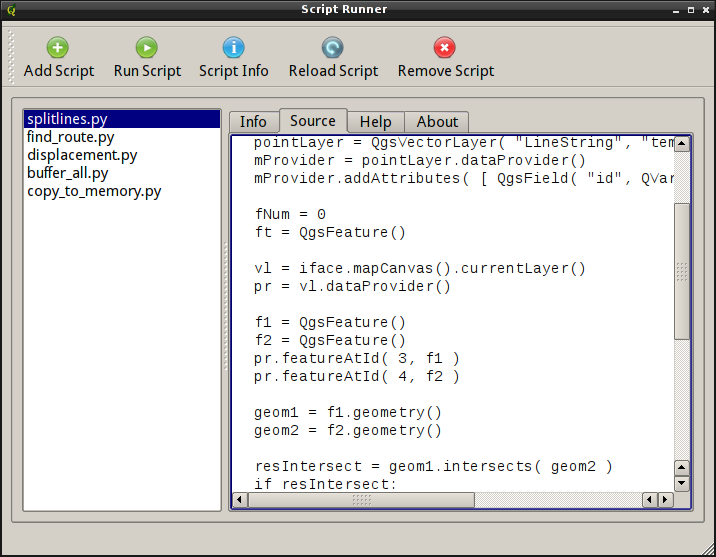
The plugin’s interface is simple: a toolbar with large buttons, a list of scripts on the left, and four tabs — “Info”, “Source”, “Help” and “About” — on the right.
Script Runner plugin
The “Add Script” and “Run script” buttons are self-explanatory: the first one adds a script to the list (the list is saved between sessions), the second one runs the selected script.
Clicking the “Script Info” button will populate the “Info” tab with docstrings, function and class names from the selected script, and the script code will be loaded into the “Source” tab in read-only mode.
I think the purpose of the last two buttons, “Reload Script” and “Remove Script” is clear from their names. The first reloads the script (useful for debugging or if you need to tweak the code and run the process again), and the second removes the script from the list (leaving the file on disk).
Script Runner has only one requirement for scripts: they must have an entry point. The entry point is simply a run_script function that takes only one argument, a reference to the qgis.utils.iface object. If such a function is not present in the code, the script will simply not be recognised and loaded by the plugin.
The script logic can be implemented either within the run_script function or in separate functions called from it. It is also possible to use an OOP approach. In this case, you need to create an instance of the class in run_script and call the necessary method(s).
Here is a simple example (the script creates an empty LineString memory layer):
Last year I wrote “Getting started with openModeller” post which gave an overview of openModeller - a free open-source ecological niche modelling tool - and showed how to run experiments in the openModeller desktop GUI. However, it is often faster and easier to perform the necessary actions using command-line tools. This is the subject of this post.
I’ve already posted a couple of beautiful videos showing the QGIS development process (first, second) made with Gource. Here are a few more, this time made by myself.
A complete history, from the beginning of development to 25 January 2012.
Developers activity from 1 September 2011 to 26 January 2012 (805 commits were made)
With the release of QGIS 1.7.0 it was announced that a new official plugin repository has been created with many features (a rating system, lists of recommended and recently added plugins, etc.). In addition, a dedicated section for 3rd-party plugins has been created in the QGIS bug tracker, where plugin authors can create a homepage, wiki, bug tracker, and code repository for their plugins. The main goal of all this is to provide a single repository for plugins and a single place to report bugs for both plugins and QGIS itself.
And although the new repository has been put into production and added as the default repository in the QGIS 1.9.90, plugin developers are still holding back on using it (at the time of writing, there are only 35 plugins in the new repository, for comparison, there are 111 plugins in the old repository). This can probably be explained partly by ignorance and partly by the somewhat confusing procedure for adding a plugin to the new repository.
Let’s try to figure this out.
I assume that the plugin code has been published to one of the public code repositories, such as GitHub or BitBucket, and now we want to set up a bug tracker and wiki on hub.qgis.org. This will make life a bit easier for users: they will be able to use their existing account to file bug reports. To do this:
go to hub.qgis.org and log in
open the “Projects” section and click on the “New Project” button, or go to the “User Plugins” subsection and click on the “New Subproject” button
fill in the form (note that in the “Subproject of” list you should select “User plugins”): enter the name of the plugin, a short description, and a link to its homepage (if available). Here, you can also select the necessary components of the bug tracker (wiki, tracker itself, calendar…). Most settings can be changed later
once you have completed the form, click on the ‘Save’ button. That’s it, a new project has been created
The bug tracker and code repository are ready. All we need to do now is upload the plugin to the plugins repository.
Before creating an archive and uploading it to the server, we need to fill in the metadata in the plugin’s metadata.txt file, specifying the URLs of the bugtracker, repository and homepage (more details). Here’s an example:
[general]name=Cool Plugindescription=Does some useful actions with your datacategory=Vectorversion=1.0.0qgisMinimumVersion=1.7.2icon=icons/pluginicon.pngauthorName=usernametags=vector, bounding box, bufferexperimental=Truedeprecated=Falsehomepage=http://someserver.com/coolplugin.htmltracker=http://hub.qgis.org/projects/coolpluginrepository=http://github.com/username/coolplugin
Save the changes in the metadata.txt file and create an archive with the plugin. Now we are ready to upload the plugin to the new repository:
use the “Share a plugin” link in the sidebar to open the upload form
select the plugin archive, activate the “Experimental” checkbox if necessary, and click “Upload”
If the plugin is packaged correctly and the metadata contains no errors, the archive will be uploaded to the server. Otherwise, an error message is displayed, and the upload is cancelled. Once the errors have been corrected, the upload should be repeated.
The uploaded plugin gets an unapproved status and is not immediately available to all users. It will only be added to the list of publicly available plugins after approval from the administrator. This will happen every time you upload a new version, even if your plugin has already been approved. This policy may be changed in the future.
There is also a small script to upload the plugin archive to the server. For example, you can add it to the post-commit hook or Makefile and upload new versions without a browser.
As you can see, there is nothing complicated about using the new infrastructure.
Another year has passed. It is time to remember all the interesting and important events.
QGIS 1.7.0 has been released. It is positioned as a long-term support version and the last release of the 1.x series. The project has radically upgraded its infrastructure: the repository has been moved to GIT (main mirror is GitHub), the separate bug tracker and wiki have been replaced by Redmine. A new plugin repository has been launched, providing developers with a code repository, bug tracker and plugin description page. This repository already contains several unique plugins and is included by default in the development version of QGIS.
After much deliberation, I entered a competition for scientific and practical projects on the problem of forest fires. My modest result was third place.
A Russian translation of the PyQGIS Developer Cookbook has been published on the QGIS website. Unfortunately, another translation I was working on remained unfinished for various reasons. I released 4 new plugins in addition to the existing ones, and the same number of plugins remained in a suspended state. I have written some HOWTOs, actually there are a lot of topics to cover, but no mood or inspiration to write anything.
Unfortunately, I missed both QGIS hackfests. I’ve started reading a lot again, and I’ve made a list of films I want to watch, which I’m slowly whittling down.
In general, the proposed changes were well received and sparked another wave of discussion about the plugin situation. At the same time, the main drawback of the proposed approach was pointed out — now, after activating a plugin, it is not known in which menu it will appear. To solve this problem, the Plugin Manager had to be modified, and another tag had to be added to the plugin metadata.
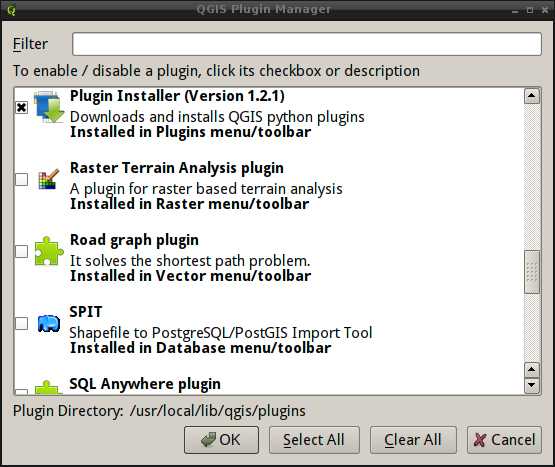
The new category metadata is for informational purposes only and should contain the name of the menu where the plugin will be placed after activation. This information is displayed in the Plugin Manager.
Category metadata in the Plugin Manager
If there is no category metadata, the default value “Plugins” is used.
Oh, and one more thing. Plugins written in C++ need to be recompiled. It is a small API break.
It is still the responsibility of the plugin developer to place the plugin in the correct menu, and there are many API calls available for this purpose. These methods can be used to add the plugin to any menu or toolbar.
What’s this all about? Well, about 20 minutes ago, it stopped being an experimental branch and was merged into master. So if you don’t find “Add Delimited Text Layer” in the “Plugins” toolbar tomorrow, don’t say you weren’t warned :-).
I am not going to discover America by saying that the number of different plugins for QGIS is constantly growing (190 at the time of writing) and it is difficult to navigate the “Plugins” menu with a dozen or two active plugins. This issue has been raised many times at hackfests, starting with the Vienna meeting, and on the mailing lists.
Periodically, new tickets were filled: #1602, #1734, #4069. One of the results was moving fTools to the “Vector” menu (the menu is created by the module itself), soon the “native” “Raster” menu was added, and a bit later — the “Database” menu (it appears when the first plugin belonging to this menu is activated). But the vast majority of plugins, including core plugins, continued to huddle together in the “Plugins” menu and place their buttons on the corresponding toolbar.
Meanwhile, in ticket #4395, Paolo again raised the question of moving at least the core plugins into the appropriate menus. This is where it all started.
Firstly, the Offline Editing and SPIT plugins have been moved to the “Database” menu. The “Oracle GeoRaster” and “SQLAnywhere” plugins lost their menu items altogether, and their buttons were moved to the “Layers” toolbar and duplicated in the “Layers” menu. After a brief discussion with Paolo, the “repression” continued:
raster plugins have been moved to the “Raster” menu and toolbar
a “native” “Vector” menu and toolbar have been created for plugins that work with vector data. fTools and a few other core plugins have been moved there
the “Add Delimited Text Layer” plugin has been moved to the “Layers” toolbar
the “GPS Tools” have been split: one button has been moved to the “Layers” toolbar and the other to the “Vector” menu
the “Database” toolbar has been created, and the “Offline Editing” and “SPIT” plugin buttons have been moved there
new methods have been added to allow plugin developers to place their plugins in the desired location
Some plugins have not been moved anywhere yet:
eVis (“Database”?)
OpenStreetMap (a new category “Web” is proposed)
MapServer Export (a new category “Web” is proposed)
RoadGraph (probably “Vector”)
GRASS
Coordinate Capture
Diagram Overlay
So far, all this exists as a reorganise-plugins branch in my fork. The question of merging it has been raised on the mailing list. The main disadvantage (relative in my opinion) - when activating the plugin, the user will not know where exactly, in which of the 4 menus it (the plugin) will appear. One solution is to add a tag to the plugin’s metadata that specifies which section the plugin will be placed in after installation.
The 6th Quantum GIS developer meeting in Zurich (Switzerland) ended on Monday. Below are my impressions, supplemented with information from Tim’s blog.
This meeting was more “quiet” than the previous ones: the presentations were only held on the first day (but the picture and sound were very good), there were no announcements of the presentations on IRC, so it wasn’t always clear who was speaking and what the topic was.Some topics were discussed on IRC and the mailing lists, if you wanted to, you could contribute with your comments, suggestions or topics. Subjectively, there were not that many commits, partly due to the use of GIT, but still not that many changes compared to previous hackfests.
One of the main discussions was on issues related to topology support. This was facilitated by the presence of Sandro Santilli, one of the developers of GEOS and PostGIS. Topological editing has been discussed almost since the introduction of digitising support in QGIS. At the meeting, we discussed the possibility and prospects of creating a common mechanism for topological editing of different data, but in the end, we decided to keep all three existing systems (simple features, the GRASS topological model, and the PostGIS topological model). This decision was made because of the large differences in the underlying models. Of course, if someone proposes a worthy implementation of the universal mechanism, it will be gladly considered.
As QGIS has expanded from the desktop market to the web, discussions about QGIS Server and, more recently, QGIS Web Client have become an integral part of meetings. Some of the results of these discussions can be found on a dedicated wiki page.
Finally, the move to GitHub is complete: all the documentation was moved there during the hackfest. The migration was accompanied by a change in directory structure, and a description of the new workflow for translators will be published soon. There are also plans to abandon LaTeX in favour of RST (ReStructured Text), which should lower the barrier to entry for both authors and translators.
Since the preparation of new QGIS releases is quite complex and time consuming task, Tim has taken Werner on as his assistant. Tim will prepare the main releases, and Werner will do the point releases. By the way, the upcoming release 1.7.2 is his first work at this position.
As preparing new QGIS releases is a complex and time-consuming task, Tim took on Werner as his assistant. Tim will prepare the major releases and Werner will prepare the point releases. The upcoming 1.7.2 release is his first work in this position.
Strangely enough, although everyone has been talking about revising and updating the API for a long time, nothing has been broken yet (I was hoping this process would at least start at haskfest). At the same time, so much new functionality has been added that it was decided to make 1.7.2 the last release of the 1.7 series and then release 1.8.
In addition to the topics already mentioned, the following issues were also discussed to a greater or lesser extent:
QGIS on Android
performance testing and identification of bottlenecks in vector data handling
new infrastructure (wiki migration, bugtracker improvements, new plugins repository, styles repository)
revival of unit testing and the launch of the project’s Dart server
user interface optimisation and redesign for version 2.0 (1, 2)
overhaul of the QgsGeometry class (adding support for curves, splines, collections)
As for me, I was not in the mood to fix bugs, nor did I have any special plans. So I was mainly busy adding new bugs :-) by adding new tools to fTools and GdalTools.
Quite often, I have come across the question: How can I use the georeferenced rasters (raster + map file) from OziExplorer in QGIS? In order to use such data in a GIS, it is usually necessary to convert them first, e.g., with GlobalMapper. With the release of GDAL 1.7.1, there is no need for proprietary software, as GDAL now supports OZI map files.