openModeller command-line tools
02.02.2012 12:44 · GIS · openmodeller, howto
Last year I wrote “Getting started with openModeller” post which gave an overview of openModeller - a free open-source ecological niche modelling tool - and showed how to run experiments in the openModeller desktop GUI. However, it is often faster and easier to perform the necessary actions using command-line tools. This is the subject of this post.
General information
As mentioned in the previous post, openModeller has a modular architecture: the main functionality is provided by the openModeller library, algorithms are loaded as plugins, and several interfaces have been developed to access the library functions. One of the first interfaces implemented was the command-line interface.
The openModeller command line interface is represented by several applications, each of which is designed to solve a specific task. All applications have the prefix om_ and at the time of writing there are 10 of them:
om_consoleom_viewerom_nicheom_samplerom_modelom_testom_projectom_algorithmom_pointsom_pseudo
Note
Some applications (namelyom_viewer and om_niche) depend on additional components, and if your system does not have the necessary components, they may not start or may not be available at all.Let’s look at each application in detail. Where possible, I will use an adapted version of the test dataset from the openModeller distribution for demonstration purposes.
om_console
Console frontend to the openModeller library. Used to generate and project (apply) potential distribution models. Takes a request file as its only argument.
om_console request.txt
openModeller request files are described in detail here.
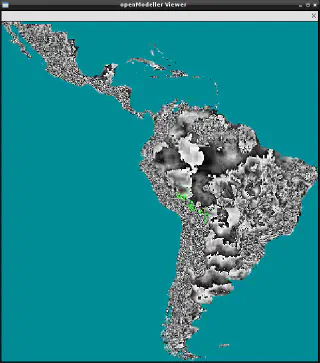
om_viewer
Warning
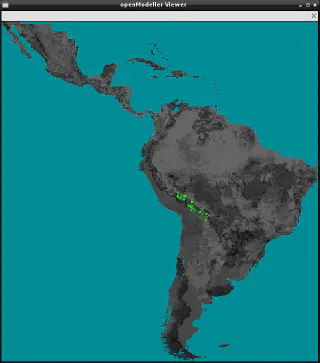
This application is only available if openModeller is built with X11 support.Visualises the environmental layers used to generate the model. In this case, it takes a request file as its only argument.
om_viewer request.txt

It can also be used to visualise the projected model by specifying the -r option.
om_viewer -r request.txt

om_niche
Warning
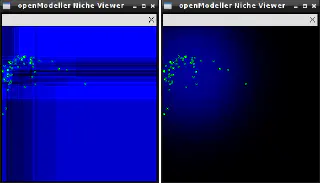
This application is only available if openModeller is built with X11 support.Performs visualisation of exported models in the environment space. Models in XML format are generated by the om_console or om_model tools.
om_niche -o furcata.xml
The image below shows the models generated from the same data using different algorithms.

This is mainly a demonstration tool and will only work if the experiment contains only two layers. Its main purpose is to show how different algorithms generate different models from the same input data.
om_sampler
During the modelling process, openModeller extracts data (pixel values) from each environmental layer used in the experiment. The set of such values for a point is called a “sample”. This application is used to obtain samples for each occurrence point.
om_sampler takes as an argument a file containing “links” to environmental layers as well as a file containing information about the occurrence points. Such a file can be a request file, an XML file with a description of model parameters, or an XML file with an exported model.
om_sampler --source request.txt
By default, om_sampler prints all data for each occurrence point of the source file to standard output (i.e., to the screen). However, if the --dump-env option is specified, all data for each cell (pixel) of the mask layer will be printed. A range of cells can be specified using the --cell-start (default 0) and --cell-end (default 1000) options. The first cell is the top left cell, iterating from left to right and top to bottom.
om_sampler --source request.txt --dump-env
In this mode, pixel centroid coordinates are used instead of occurrence point coordinates. If nodata is displayed for a sample, it means that there is no data in at least one of the layers (including the mask layer).
om_model
Generates a distribution model. The input data is read from an XML file containing parameters as defined by the ModelParameters element (see schema). The output distribution model is saved in another XML file as defined by the SerializedModel element of the same schema. Note that each algorithm has its own way of representing models. The --xml-req option specifies the source file with the description of the model parameters; the --model-file option specifies the output file where the generated model is written.
om_model --xml-req model_request.xml --model-file acacia_model.xml
If the model is generated for a large number of layers or occurence points, it is possible, using the --prog-file option, to specify a file to which the progress of the modelling process will be written. The progress file is a plain text file, and the following numbers can be written to it during the application run:
If the model is generated for many layers or occurrence points, the --prog-file option can be used to specify a file to which the progress of the modelling process is written. The progress file is a plain text file, and the following numbers can be written to it during the application run:
-2— if execution was aborted-1— queued0…100— execution progress
To generate a distribution map from a model, use the om_project tool.
om_test
A tool for testing distribution models. It can either take a test description file (defined according to the TestParameters element of the schema) as input
om_test --xml-req test_request.xml
or two files: the generated model file and a text file containing the occurrences points to be tested
om_test --model acacia_model.xml --points test_points.txt --calc-matrix
Note
The test points should have the same CRS and label as the training points used to build the model. The test is also performed with the same set of layers as those used to build the model.By default, the result is printed to standard output, but the --result option can be used to save it to a file (defined by the ModelStatisticsType element).
The following options can be used to tweak the testing process:
--calc-matrix— calculate confusion matrix for the training data--threshold— define probability threshold to distinguish between presence/absence points when calculating the confusion matrix--calc-roc— calculate ROC curve for the training data--num-background— define number of background points when generating the ROC curve if there are no absence points--max-omission— calculate partial area ratio for points under the maximum omission
om_project
Projects (applies) the generated distribution model onto a set of layers. The result of this operation is a probability distribution in a raster format.
There are two ways to use om_project. In the first case, as a source file, it is necessary to pass an XML file containing the projection request (e.g., see the projection_request.xml file in the archive. A full description of the ProjectionParameters element is also available). In this case, the model can be applied to a different set of layers than the one used to build the model.
Note
However, the number and type of layers used in the projection of the model must be the same as those used in the creation of the model.
In this case, om_project is run as follows:
om_project --xml-req projection_request.xml --dist-map furcata.img
The --dist-map option specifies the output file to which the result of the model projection (distribution map) is written.
In the second case, om_project takes the file with the generated model as an input, and the model can only be applied to the same layers that were used to create it. In this case, you can also specify the layer to be used as a template (--template) and the desired format of the final image (--format).
om_project --model acacia_model.xml --dist-map acacia.img
You can also specify a progress file (--prog-file) and a projection statistics file (--stat-file).
om_algorithm
Used to get information about available algorithms. For example, the command:
om_algorithm --list
will print a list of all available algorithms in the format id:name.
To get detailed information about a particular algorithm, use the following command:
om_algorithm --id alg_id
where alg_id is the identifier of the desired algorithm.
And by specifying the --dump-xml option, you can output algorithm information in XML format (by default, the information is printed to standard output, use redirection if necessary).
om_points
This tool is used to download occurrence points from various sources and save them in text or XML format.
Occurrence points will only be loaded from sources that have a driver implemented in openModeller. If necessary, you can create your own drivers to work with additional data sources. The command:
om_points --list
will return a list of all available drivers in the format “id:name (access mode)”. At the time of writing, support for the following data sources has been implemented:
- TXT — delimited text file. This driver reads points from text files (tab or comma-separated) located on the local disk. The file must contain the following columns: identifier (id), label, longitude, latitude and (optionally) abundance of a species at a given point. This driver is always available and can be used to write data from other sources. Supports reading and writing
- XML — XML file. This driver is always available and can be used to write data from other sources. The occurrence points are stored according to the definition of the
OccurrencesTypeelement of the schema. Files in this format can also be used as input data for theom_samplertool. Both reading and writing are supported - GBIF — retrieving data from GBIF Web Service. The driver is available only if openModeller is built with libcurl support. At the time of writing,
http://data.gbif.org/ws/rest/occurrence/listendpoint should be used as the source. This driver is read-only - TerraLib — Retrieve data from the TerraLib database. The driver is only available if openModeller is built with TerraLib support. As a source, it is necessary to specify the connection string in the format
terralib>dbUsername>dbPassword@dbType>dbHost>dbName>dbPort>layerName>tableName>columnName - TAPIR — Retrieve data from the TAPIR web service using DarvinCore 1.4 and spatial extensions. The driver is only available if openModeller is built with libcurl support. The TAPIR entry point must be specified as a source. This driver is read-only
The following options can be used to tweak the retrieval of occurrence points:
--source— a data source. This can be a path to a file on disk (for TXT and XML drivers), a URL (for GBIF and TAPIR ) or a connection string (for TerraLib)--name— name (label) by which the points are filtered. Each point in a source has a name that allows you to get only the data you need--wkt— CRS of occurrence points. The default is latitude/longitude with WGS84 datum. It is only useful when using XML as the output format, as it has acoordinateSystemtag.If this option is used, the value must be in WKT format with escaped double quotesNote
Most drivers assume that points are already stored in latitude/longitude WGS84.--type— output driver (TXT or XML). The default is TXT--split— will split the retrieved points into two sets in the given ratio (defined by a value from the range0...1). The results are saved to files specified by the--file1and--file2options. This can be useful for creating training and test data sets--file1— file to save the first subset of points when splitting. Mandatory only if the--splitoption is used--file2— file to save the second subset of points when splitting. Mandatory only if the--splitoption is used
For example, the command
om_points --source http://data.gbif.org/ws/rest/occurrence/list --name "Physalis peruviana"
will query the GBIF database for occurrences of the species “Physalis peruviana” and output the retrieved data to standard output in TXT format.
om_pseudo
Generates random points within a given geographical area (mask). The result is printed to standard output as TAB-delimited text compatible with openModeller. Points are generated in latitude/longitude with WGS84 datum.
om_pseudo --num-points 20 --mask rain_coolest.tif
The following options can be used to tweak the way points are generated:
--num-points— number of points to generate--mask— mask file. This is a raster in a format supported by openModeller. Points will not be generated in cells (pixels) containing the NODATA value--label— label to assign to points, defaults to"label"--seq-start— identifier of the first point (integer value), next points will follow the sequence. Default value is1--proportion— Percentage of absence points, default value is ‘1’ (all points are absence points)--model— an XML file containing the generated model. If this option is specified, points will only be generated in cells where the model predicts a probability less than the specified threshold--treshold— probability threshold, used in conjunction with the--model' parameter. Accepts a value in the range0…1, default is0.5`--env-unique— can be used with the--modelparameter to avoid repetition of environmental conditions for points. This uses the same layers that were used to create the model--geo-unique— do not create points with the same coordinates
Conclusion
As you can see, the functionality of the command-line tools is on par with the graphical interface. The console nature and lower resource consumption compared to openModeller Desktop make them an ideal solution for automated data processing, selecting the most optimal algorithm, as well as for working with large amounts of data.