Getting started with openModeller
02.05.2011 10:00 · GIS · openmodeller, howto
Let’s take a look at openModeller, a flexible, robust, open source and cross-platform framework for running ecological niche modelling experiments.
Overview
There are a number of applications for carrying out basic ecological niche analysis. Among the best-known are Bioclim, DesktopGARP, MaxEnt and others. Typically, each of these applications is designed to use a specific algorithm, and in general, they are all proprietary products. In addition, each application has its own system requirements (e.g., it requires Java or only works on the MS Windows) and source data requirements. All this means that a user who wants to use different algorithms has to learn new software and adapt the source data.
To address these (and some other) shortcomings, the Centro de Referência em Informação Ambiental (CRIA) started work on openModeller in 2003 as part of the speciesLink project. Now, in addition to CRIA, the Escola Politécnica da USP (Poli), the Instituto Nacional de Pesquisas Espaciais (INPE) and volunteer developers are involved in the development. Financial support is provided by the Fundação de Amparo à Pesquisa do Estado de São Paulo (FAPESP) and the Incofish project. The BDWorld project (University of Reading), University of Kansas Natural History Museum & Biodiversity Research Center (KU) have been involved in development at various times.
The main goal of the openModeller project is to provide a convenient tool for researchers interested in ecological niche modelling. The applications are developed in C++ using libraries such as GDAL, GSL, TerraLib. All openModeller tools are available for Windows, Linux and Mac OS.
The modular architecture makes it easy to add new algorithms. Algorithms such as GARP, Bioclim, CSM, Environmental Distance and many others have already been implemented as plugins. Providing all algorithms within a single architecture makes it easy to compare results from different methods, as all models can be built using the same data and results can be obtained in the same format.
The project is made up of several parts. The first and most important is the openModeller library, which provides a common platform for all other parts of the project. It deals with reading data that represent environmental parameters and species location, loading and running algorithms, and saving analysis results. In addition to the library itself, bindings to C++ and Python are available.
A SOAP based Web Services API allows you to run simulations on remote machines. A CGI application is also provided to integrate openModeller with the Apache web server.
A number of command-line tools have been developed. om_console allows models to be run using text configuration files describing input data and algorithm parameters. om_create and om_project allow openModeller to be used with configuration files in XML format. There are other utilities, e.g., om_sampledump allows you to extract data about each sample point and save the result as delimited text.
There is also a cross-platform graphical user interface (using the Qt widget library) called openModeller Desktop for end users.
Installation
openModeller is available in two flavours: a core system with auxiliary console applications (openModeller) and a graphical interface (openModeller Desktop). There is also a QGIS plugin that allows you to set up experiments and view the results without leaving the GIS.
At the time of writing, the latest available version is 1.1.0, and there are installers for Windows, RPM packages and source tarballs for Linux, and DMG files for Mac OS (see the project’s downloads). If you want to use the latest version, you can get the source code from svn:
svn co https://openmodeller.svn.sourceforge.net/svnroot/openmodeller openmodeller
and build it yourself. The QGIS plugin is not available in binary form, so if you need it, you will need to compile openModeller.
Usage
In this post, we will work with the openModeller Desktop application, which allows you to use all the features of openModeller without having to resort to programming and without using the command line.
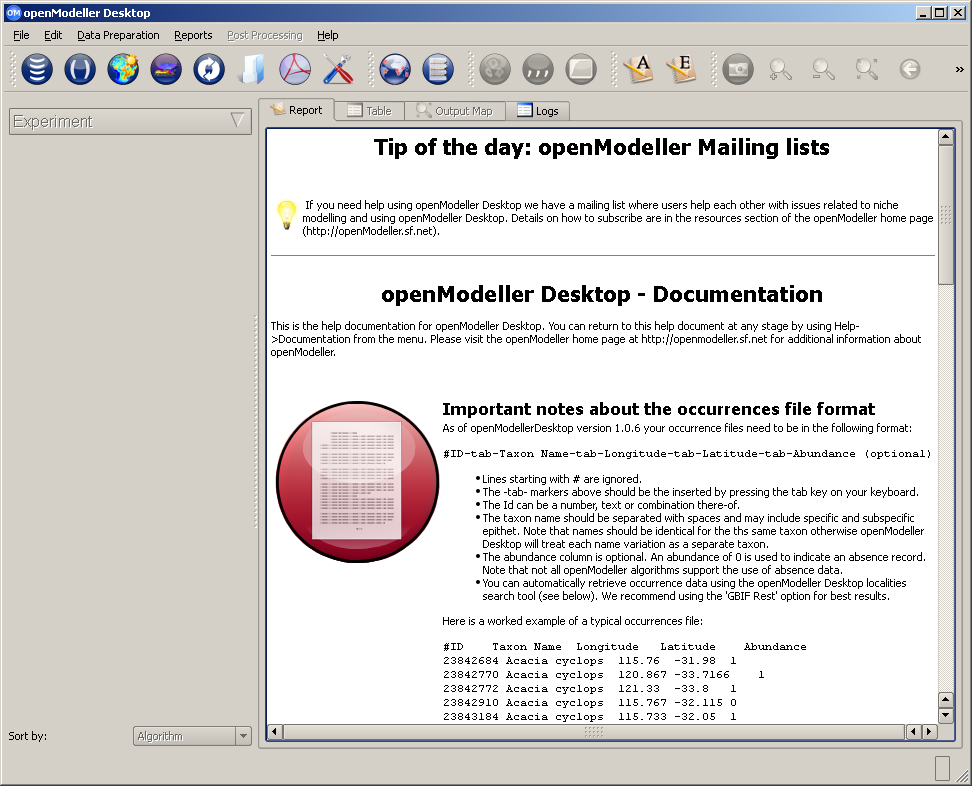
With openModeller Desktop you can:
- automatically retrieve species distribution data from specialised databases such as GBIF and speciesLink
- manage raster layers used in modelling
- configure parameters of the algorithms included in openModeller
- create experiments that will run multiple models for one or more species using one or more algorithms
- visualise the results of experiments and view the output of each model in tabular form or on a map
Let’s take a closer look at the basic tools of openModeller Desktop.
Species occurrence points
Ecological niche modelling requires two types of data: species distributions (occurrence points) and layers describing climate and other environmental parameters.
Species distribution data can be obtained from a variety of sources, ranging from the literature to querying relevant organisations and/or databases such as GBIF.
The openModeller Desktop provides “Search for locality data” functionality to search for occurrences in the GBIF and speciesLink databases:
- click on the “Search for locality data” button
- to access the GBIF database, you must agree to the terms of use
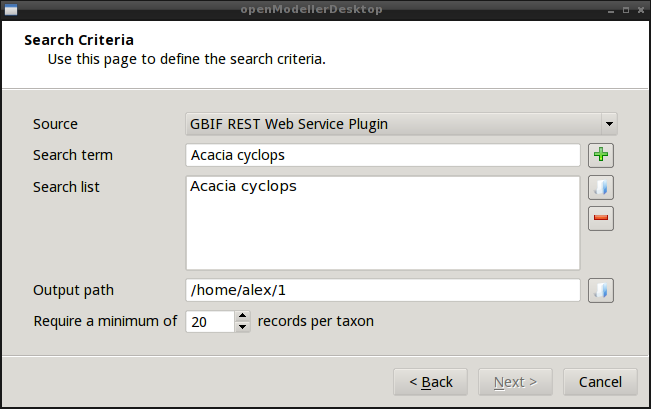
- Enter the name of the species in the “Search term” field and click the “+” button to add it to the query. You can search for several species at once. It is also possible to load the list of species from a text file (one species per line)
- specify the directory for the search results
- click “Next” to query the database
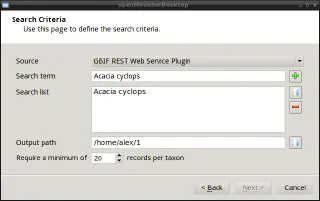
Search for locality data dialogue
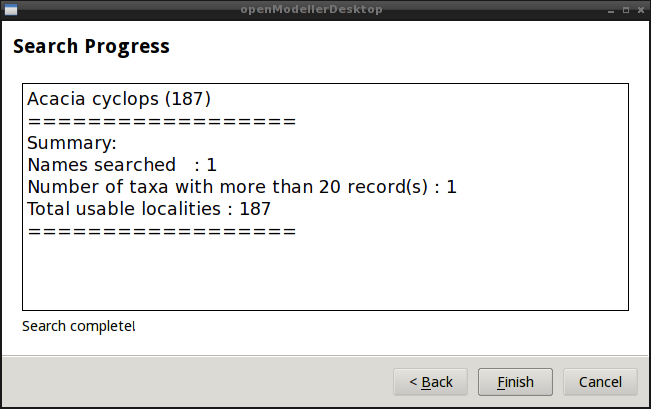
At the end of the process, a progress report is displayed and a point shapefile and a text file with locality data are saved to the specified output directory.
Warning
If the number of occurrences is high, the module may crash.Layers management
When running different experiments, we often need to use the same layers describing climate and environment. openModeller Desktop simplifies the user’s life by combining layers into so-called “layer sets” using the Layerset Manager tool.
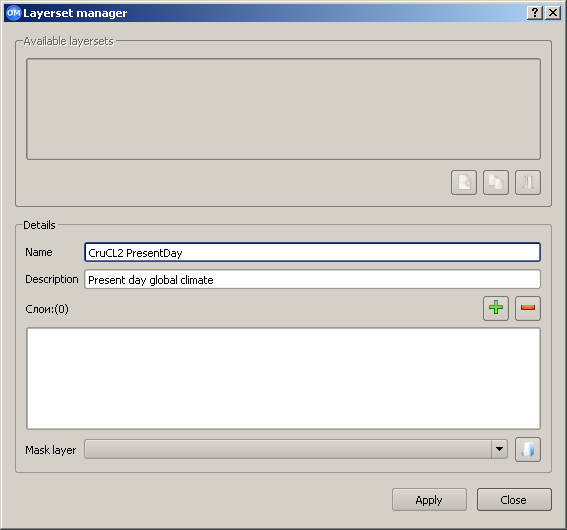
Layers can be combined into a group (layerset in openModeller terms) with a descriptive name, such as “Global Climate”, and each layerset can have a detailed description. Once a layerset has been created, it will be available for selection when creating an experiment. To create a layerset you need:
- open the “Layerset Manager” dialogue by clicking the “Layerset Manager” button
- define a name for the new layerset and an optional description
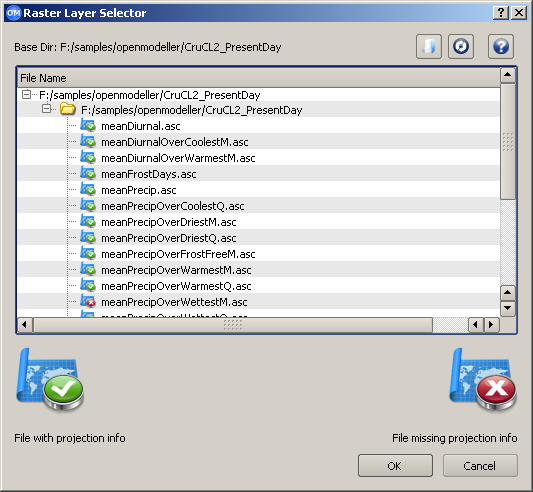
- click on the button with the green “+” sign and specify the directory containing the layers you want to add to this layerset
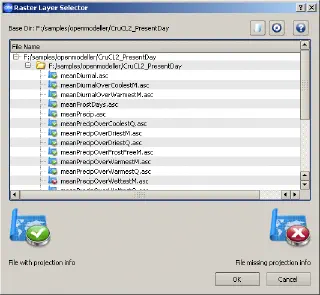
Adding layers to a layerset in openModeller - select required layers and click “OK”
- if necessary, repeat steps 3–4 to add layers from another directory
- when you are finished adding layers, click the “Apply” button to create a new layer set
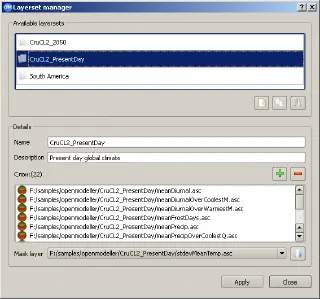
Layersets in the Layerset Manager dialogue

Algorithms management
The Algorithm Manager allows you to view all the available modelling plug-ins included in the openModeller library.
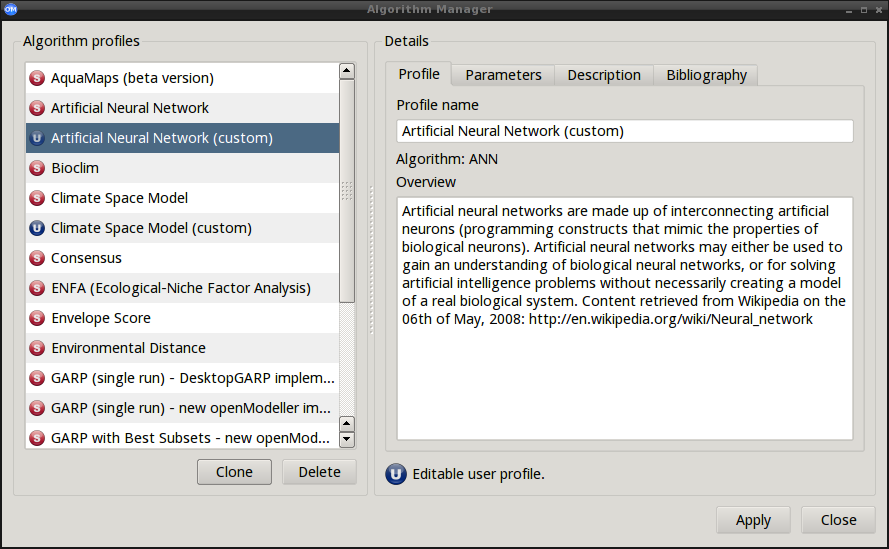
All algorithms are supplied with preset default parameters (defined by the algorithm author) and can be used without further customisation. In the Algorithm Manager, these parameters are displayed as unchangeable “system profiles”. “System profiles” can be cloned to create “user profiles” that can be modified by the user. Changing algorithm parameters requires knowledge of the algorithm, but also gives experienced users greater flexibility and control. Beginners can simply use the “system profiles” without modification.
Example
One of the aims of ecological niche modelling is to identify areas that are vulnerable to invasive species. In this example I will show how openModeller can be used to find areas vulnerable to Acacia cyclops. Acacia cyclops is a plant native to south-western Australia, but it can spread to other parts of the world.
First of all, it is necessary to obtain information on the locations of Acacia cyclops, which can be done using the “Search for locality data” tool. As the received file contains data for the whole world, I have edited it to keep only occurrences in Australia. This was done to create a model based solely on the original distribution of the species.
I then used the Layerset Manager to create a layerset of 23 layers containing data on temperature, precipitation, etc. The layers were downloaded from the Climatic Research Unit (CRU) website.
Species distribution data, layers describing climate and ecology, and the algorithm are the three main components of an experiment. The Experiment designer allows you to specify how these components should be linked.
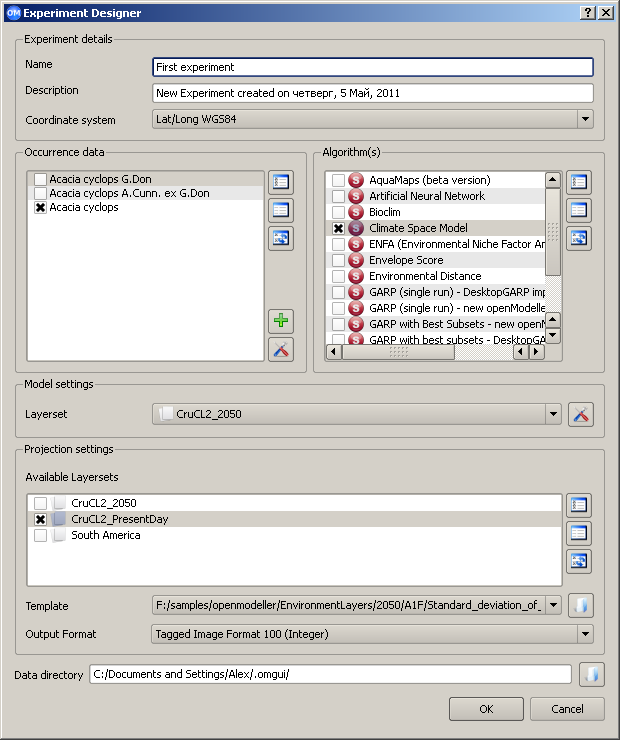
Each experiment has a unique name and description. The Experiment Designer allows the creation of complex experiments that model the distribution of several species using different algorithms. The modelling process is performed by a special module, a so-called “modeller plugin”. At the time of writing, there are two such modules:
- “local”, which uses the openModeller library directly
- “web services”, which is used to send jobs to a remote server via the openModeller Web Services API
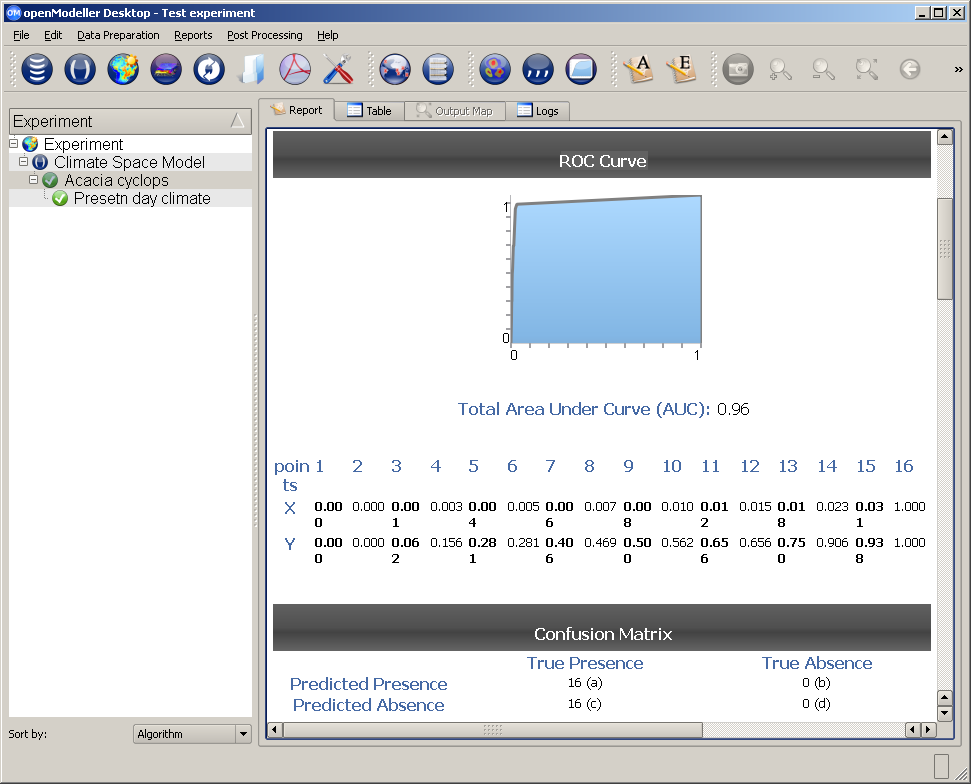
At the end of the modelling process, we will see the results of the experiment in a tree-like structure in the main window. The root element corresponds to the experiment itself, the second level elements correspond to the algorithm profiles used, and the leaf nodes represent individual models.
After selecting a model, a detailed report of its execution is displayed in the right part of the openModeller window, and the model results can also be viewed on the map. The map viewer is built on top of the QGIS libraries and allows you to pan, zoom, and export map to image.
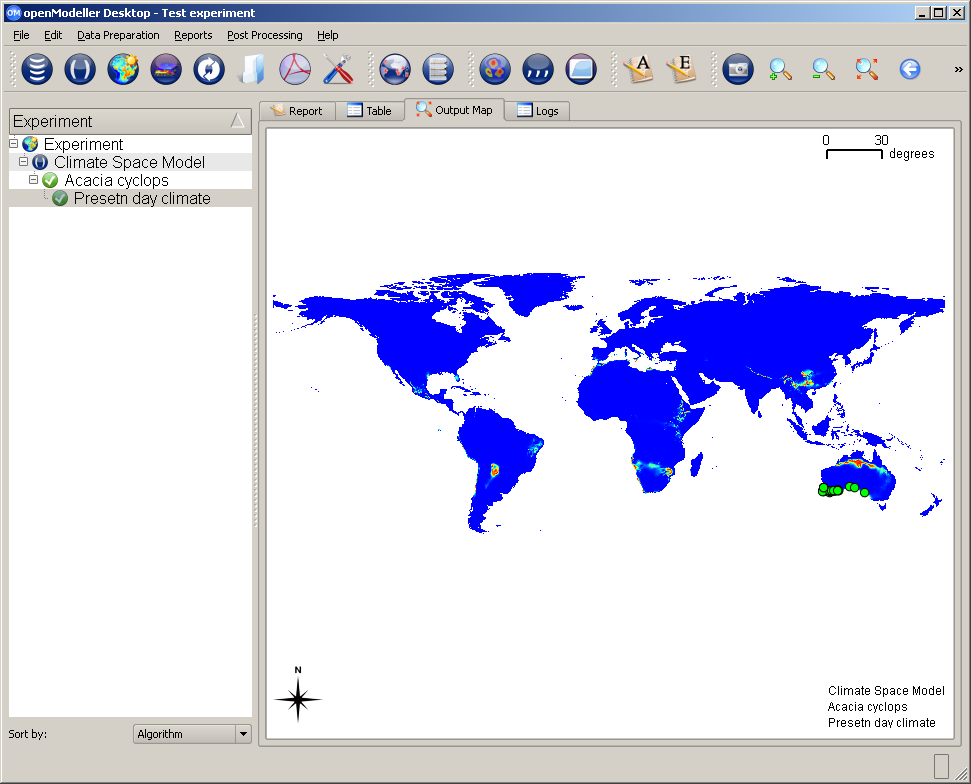
In this example, data on the distribution of Acacia cyclops in Australia were used to create a model which was then applied to a global dataset. The figure below shows the results of applying the model to south-western Australia.
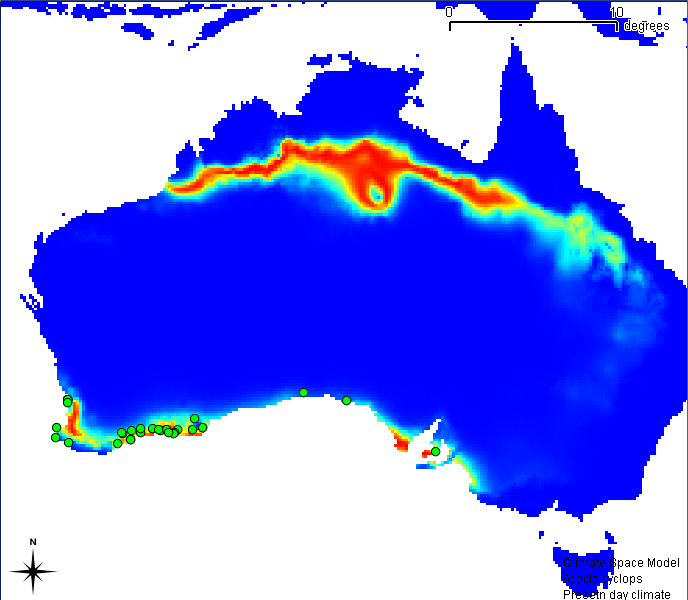
The initial occurrences used in the modelling are shown as green dots. Areas with a low probability of occurrence of this species are shown in blue. The gradient from blue to yellow and then to red shows areas of increasing probability of occurrence. This means that if a plant is introduced into the area shown in red, the probability of its survival is very high. Below is a result of the same model, but for the Southern Africa region.
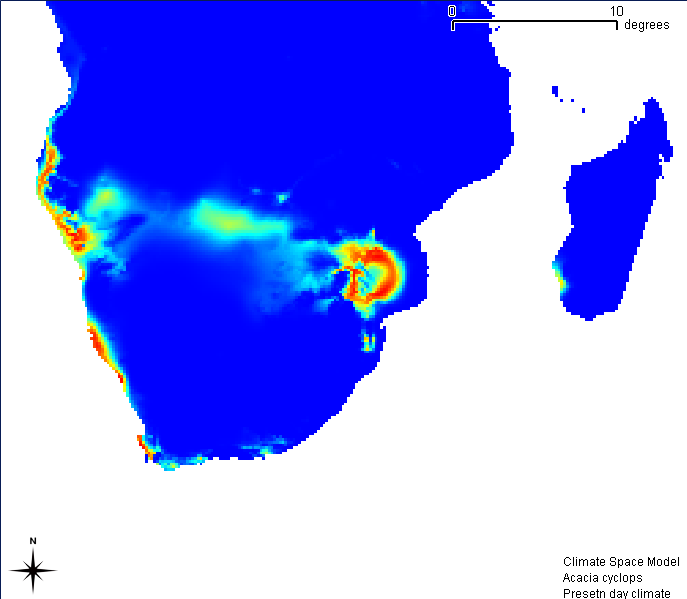
As we can see, based on the model, it can be argued that Southern Africa has areas with optimal environments for Acacia cyclops to grow. And indeed, Acacia cyclops is a problematic invasive plant that was introduced to Africa to be used as a dune stabiliser.
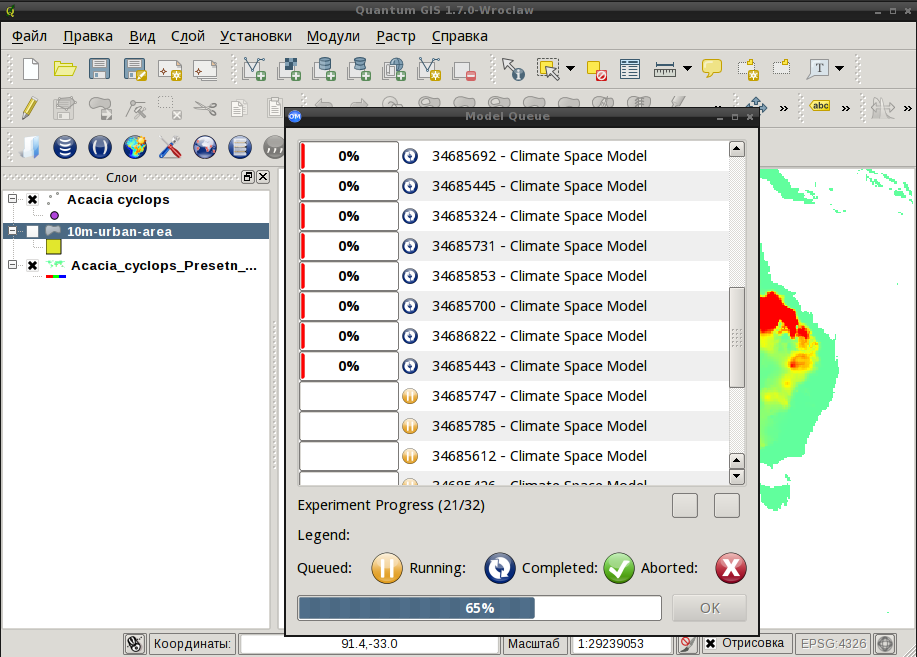
And this is the openModeller plugin in QGIS
Conclusion
The openModeller project provides solutions for both users and developers interested in ecological niche modelling. The openModeller library allows its functionality to be used in other programs. Numerous command-line tools allow the creation of various scripts for batch processing. The openModeller Desktop application provides a convenient user interface, and the openModeller Web Services API allows openModeller to be deployed on a powerful server and used by clients.
The modular architecture allows different techniques to be used without the need to learn new software each time or to adapt the source data to different requirements. In addition, the modular architecture allows developers to concentrate on implementing the core functionality of the algorithm rather than being distracted by creating interfaces and input/output procedures.
The openModeller desktop application and the QGIS plugin provide an environment where you can perform all operations, from data preparation to planning and running the experiment and visualising the results.