In the post “Getting started with openModeller” I showed how to use openModeller Desktop to identify areas at risk from invasive species. Another task that can be done with openModeller is modelling the distribution of species under new climate conditions.
Let’s see how to do it.
Preparation
As mentioned in the previous post, openModeller Desktop does not work with individual layers but with so-called “layersets”. Each layerset can contain any number of raster layers representing some environmental, climatic, and/or other values. Therefore, before we can start modelling, we need to create the necessary layersets. To do this:
download this demo dataset and extract the archive to any directory
start openModeller Desktop
open the “Layerset manager” dialogue by clicking on the ‘LayerSets’ button
as there are no layersets yet, we are immediately prompted to create a new one
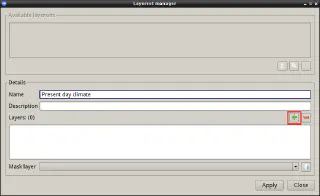
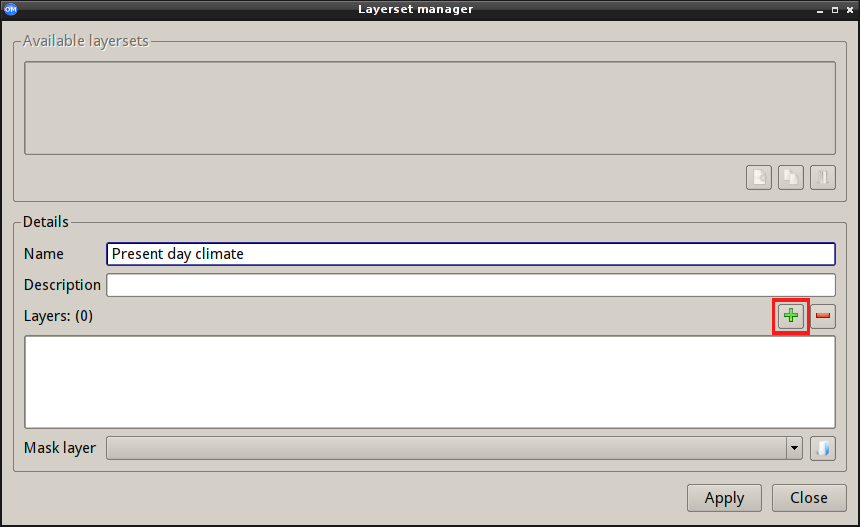
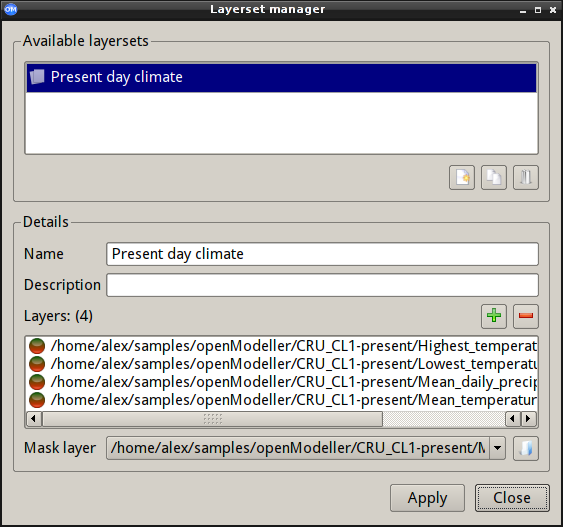
enter “Present day climate” as the layerset name, then press the green “+” button to add layers to the layersetCreating a layerset in openModeller
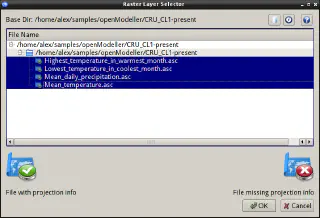
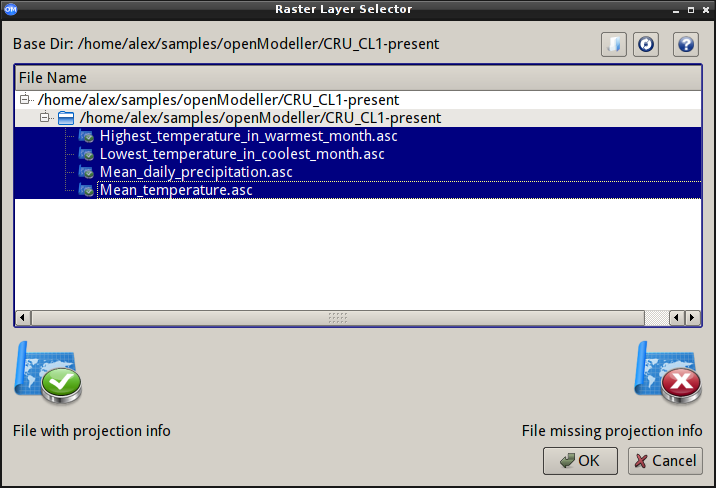
browse to the CRU_CL1-present directory of the demo dataset and select all layers in that directory and press “OK”.Adding layers to a layersetThese 4 layers describe the current climate
after clicking “Apply” in the “Layerset manager” dialogue, the new layerset will appear in the “Available layersets” listNew layerset created
Below the “Available layersets” list, there are buttons for managing layersets. We need to create another layerset, so click on the “New layerset” button (the first from the left) and follow the algorithm described above to create the “Future climate” layerset using layers from the CRU_CL1-2050A2c directory of the demo dataset.
That’s it, we’re done with the preparations.
Finding potential habitats (current climate)
With data on the occurrence of a species on one continent, it is possible to model the distribution of that species around the world. This is done as follows:
start openModeller Desktop
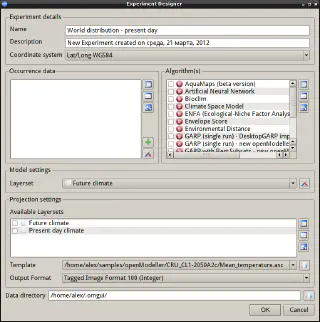
open the “Experiment Designer” dialogue by clicking the “New Experiment” button and enter the name of the experimentCreating an experiment in openModeller
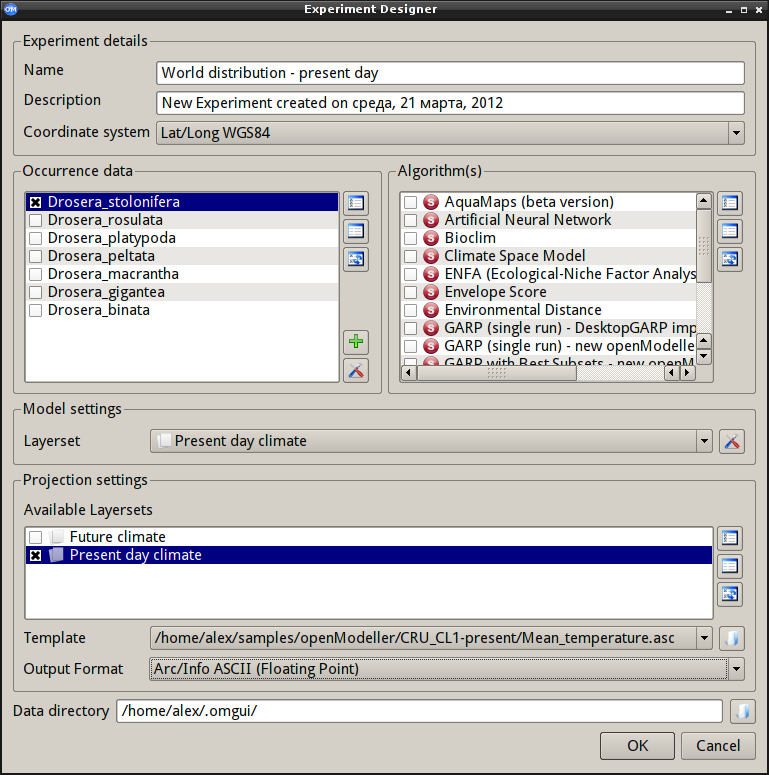
click on the green “+” in the “Occurrence data” group and open the file Drosera_localities.txt from the demo dataset. This file contains occurrence points for several species throughout Australia. Deselect all species except Drosera_stoloniferaConfiguring an experiment
select “Climate Space Model” (or any other algorithm) from the list of algorithms.
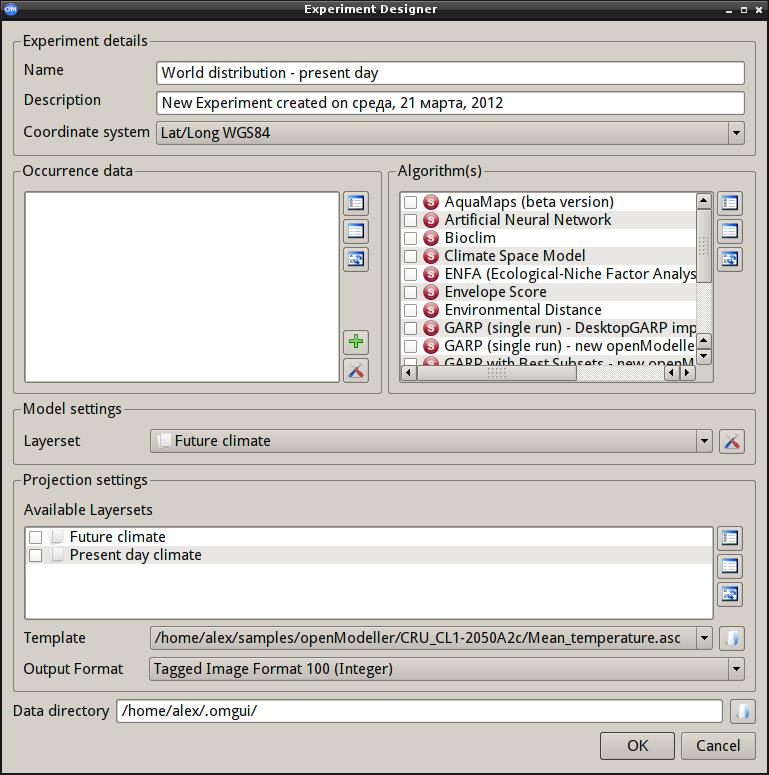
in the “Model settings” group (layerset used for training) select the “Present day climate” layerset
in the “Projection settings” group (layerset used for projection), also select the “Present day climate” layerset, as we will be looking for potential species habitats around the globe under current climate conditions
leave the “Template” field unchanged
select “Arc/Info ASCII (floating point)” from the “Output format” combobox
if necessary, change the output directory in the “Data directory” field
start modelling by clicking “OK”
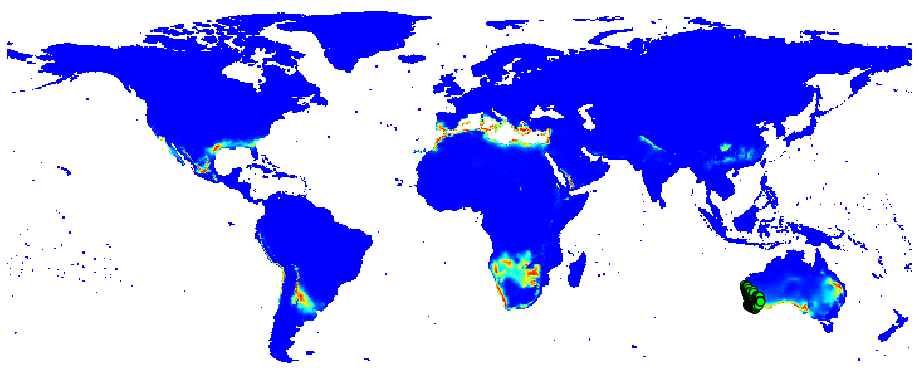
In a few minutes (depending on your computer’s performance), the model will be built and applied to the “Present day climate” layerset, i.e. we will see the locations where Drosera stolonifera can potentially be found under current climate conditions.
Distribution of Drosera stolonifera under current climate conditions
Finding potential habitats (future climate)
In order to obtain the potential distribution of a species under new climatic conditions, it is necessary to have two layersets in addition to the occurrence points: a layerset describing current climatic conditions and a layerset describing expected future climatic conditions. The model is built using the current conditions and applied to the layerset describing the expected conditions:
start openModeller Desktop
open the “Experiment Designer” dialogue by clicking the “New Experiment” button and enter the name of the experiment
click on the green “+” in the “Occurrence data” group and open the file Drosera_localities.txt from the demo dataset. This file contains occurrence points for several species throughout Australia. Deselect all species except Drosera_stolonifera
select “Climate Space Model” (or any other algorithm) from the list of algorithms.
in the “Model settings” group (layerset used for training) select the “Present day climate” layerset
in the “Projection settings” group (layerset used for projection) select both layersets “Present day climate” and “Future climate”
leave the “Template” field unchanged
select “Arc/Info ASCII (floating point)” from the “Output format” combobox
if necessary, change the output directory in the “Data directory” field
start modelling by clicking “OK”
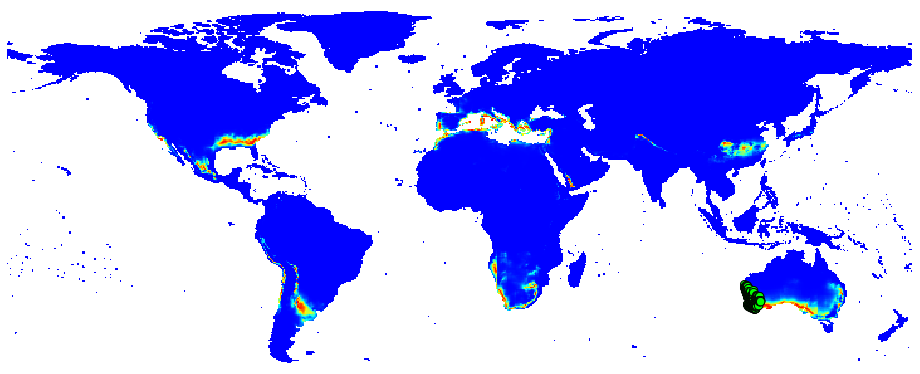
When the modelling is complete, we get two rasters showing the distribution of species under current and future climate conditions. Below is the distribution of species under future climate conditions
Distribution of Drosera stolonifera under future climate conditions
Note
There is no need to select both layersets in the ‘Projection settings’ group, as the distribution of species under current conditions was obtained in the previous step. It is therefore perfectly acceptable to use only the “Future climate” layerset in the “Projection settings” group and generate only one raster showing the distribution of species under future climate conditions. Similarly, you could omit the first example and use only the second, as this will produce both the current and future distribution maps.