Creating a raster composite from separate bands in QGIS
02.06.2011 13:24 · GIS · qgis, howto
Often, novice QGIS users who have downloaded satellite images from Earth Explorer or other sources ask themselves: “What do I do with these files, and why do I see a black rectangle or a black and white image instead of a nice color image?” The thing is that satellite images are usually distributed as separate files, each of which corresponds to a specific radiation range (channel). To get a beautiful and informative image, these channels (often called bands) should be combined, and then, depending on the task, we need to choose the right band combination.
In this post I will show you how to do this in QGIS. I will assume that QGIS is already installed and that you already have a set of rasters that make up a multi-band image, such as a Landsat scene.
Preparation
For this task we need the GdalTools plugin, which has been included with QGIS since version 1.5.0. To make sure the plugin is installed, go to the “Plugins → Manage Plugins” menu and look for the GdalTools plugin in the Plugin Manager dialog. If the plugin is present but not enabled, you should enable it.
If the plugin is not in the list of available plugins, you need to install it. To do this:
- Open the Plugin Installer from the “Plugins → Fetch Python Plugins…” menu
- In the Plugin Installer window, select the Repositories tab and verify that the Faunalia repository is added. If the repository is on the list, go to step 4.
- If the repository is not there, click the “Add 3rd party repositories” button, read the warning, and take note. Go to the “Options” tab and in the “Allowed plugins” group, activate the checkbox “Show all plugins, even those marked as experimental”.
- Go to the “Plugins” tab and use the filter to find the GdalTools plugin in the list, select it and click “Install Plugin”.
- Wait while QGIS downloads and installs the plugin. After successful installation, the plugin will be activated automatically.
- The enabled plugin creates a “Raster” entry in the QGIS main menu if it does not already exist or adds its tools to the existing menu.
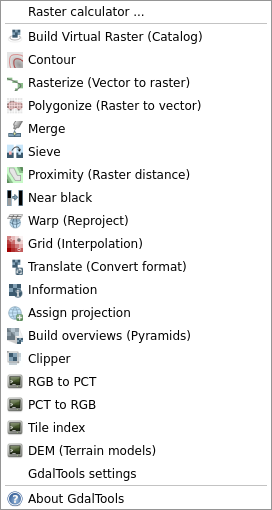
GdalTools entries in the Raster menu
Creating raster composite
Suppose we have a Landsat scene in the form of rasters representing individual image channels, 7 files in total. We need to get one file with 7 bands.
To make things easier, let’s put all 7 files into a single folder. The set of files might look like this
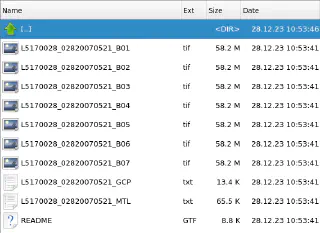
Depending on the type of Landsat scene, there may also be a much larger *_B80 file.
Go to the “Raster” menu, select “Merge”, and start filling in the dialogue box that opens:
In the “Source files” field, enter the full paths to the individual band files, separated by commas. As we have all the images in one folder, you can do this more easily by pressing “Select…” and selecting all the files by holding down the Shift key.
Note
If you don’t need all the band files (for example, if you don’t need band 6, which is usually the case because it’s a thermal band), select the files you need while holding down the Ctrl key.specify the full path to the output file in the “Output file” field. As in the previous case, the “Select…” button makes this task easier
It is better to give the output file a meaningful name.Note
The result can be saved in any format supported by GDAL. The output format can be selected from the “File Type” combo box. The default format is GeoTIFF.since we need a 7-band image, the “Create layer stack” checkbox should be checked. If you don’t check it, you will get a single-band image
if you want to view the output image, activate the “Add result to canvas” checkbox
The “Creation Options” group is worth mentioning separately. With its help, you can fine-tune the output file creation, e.g., enable compression, create world file, etc. Each output format has its own set of possible parameters, and you can check them out on the corresponding format page (list of supported formats).
For example, you can set the following parameters for the TIFF format COMPRESS=LZW, TILED=YES, TFW=YES, BIGTIFF=IF_NEEDED. This will enable Lempel-Ziv-Welch compression, force QGIS to create a world file, enable BIGTIFF mode if needed (if the file is larger than 4 GB), and create the tiled image, which in some cases increases loading and rendering speed.
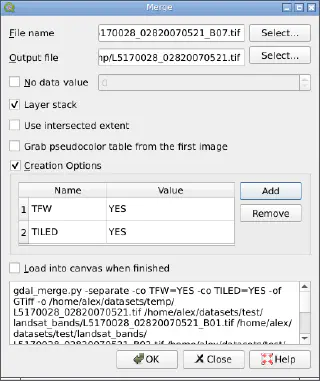
In general, the use of additional parameters requires a preliminary study, as the parameters optimal for some tasks may be unacceptable for others. At the end of the post, there is a link to a small study of different compression algorithms. So I would not recommend setting any additional creation options unless you have specific requirements and know what you are doing.
Once you have filled in all the required fields, click on the OK button and wait for the merge process to be completed.
Note that at the bottom of the dialogue box, there is a field containing the GDAL command used to perform the operation. It can be copied, edited, and executed separately if needed.
Viewing image
After combining the individual bands, we have a multi-band raster that we can now visualise.
By default, QGIS opens multiband rasters using the default 1-2-3 band combination, which is not always convenient (see this post for more details on how to change this behaviour). You can change the band combination and some other parameters that affect how the raster is displayed in the “Layer Properties” dialogue box (accessible from the layer context menu).
The band combination and contrast enhancement algorithm are set in the “Style” tab of the “Layer Properties” dialogue box.
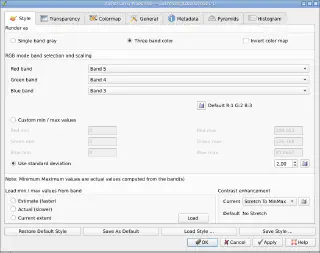
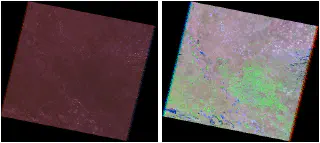
Below, you can see the same raster in QGIS with different band combinations and contrast enhancement algorithm.
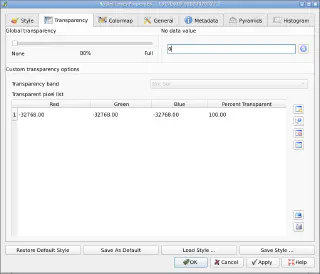
In the same window, on the “Transparency” tab, you can specify which raster values to use as NODATA. In our example, the black areas around the image have a value of 0 (zero), so to remove them, we set 0 as the ‘No data’ value.
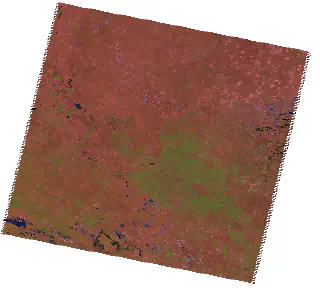
Now, our raster is displayed without any black areas, which is particularly useful when you need to display several overlapping scenes.
Useful links
For those who would like to learn more about different raster compression options and Landsat band combinations, I suggest the following links as a starting point: